Labeled LC-MS Workflow
This is a tutorial for processing Labeled LC/MS data files through El-MAVEN.
Preprocessing
msConvert is a command-line/GUI tool that is used to convert between various mass spectroscopy data formats, developed and maintained by proteoWizard. Raw data files obtained from mass spectrometers need to be converted to certain acceptable formats before processing in El-MAVEN.
Input
msConvert supports the following formats:
- .mzXML
- .mzML
- .RAW ThermoFisher
- .RAW Walters
- .d Agilent
- .wiff ABSciex
The settings used for msConvert as a GUI tool are captured in the following screenshots:
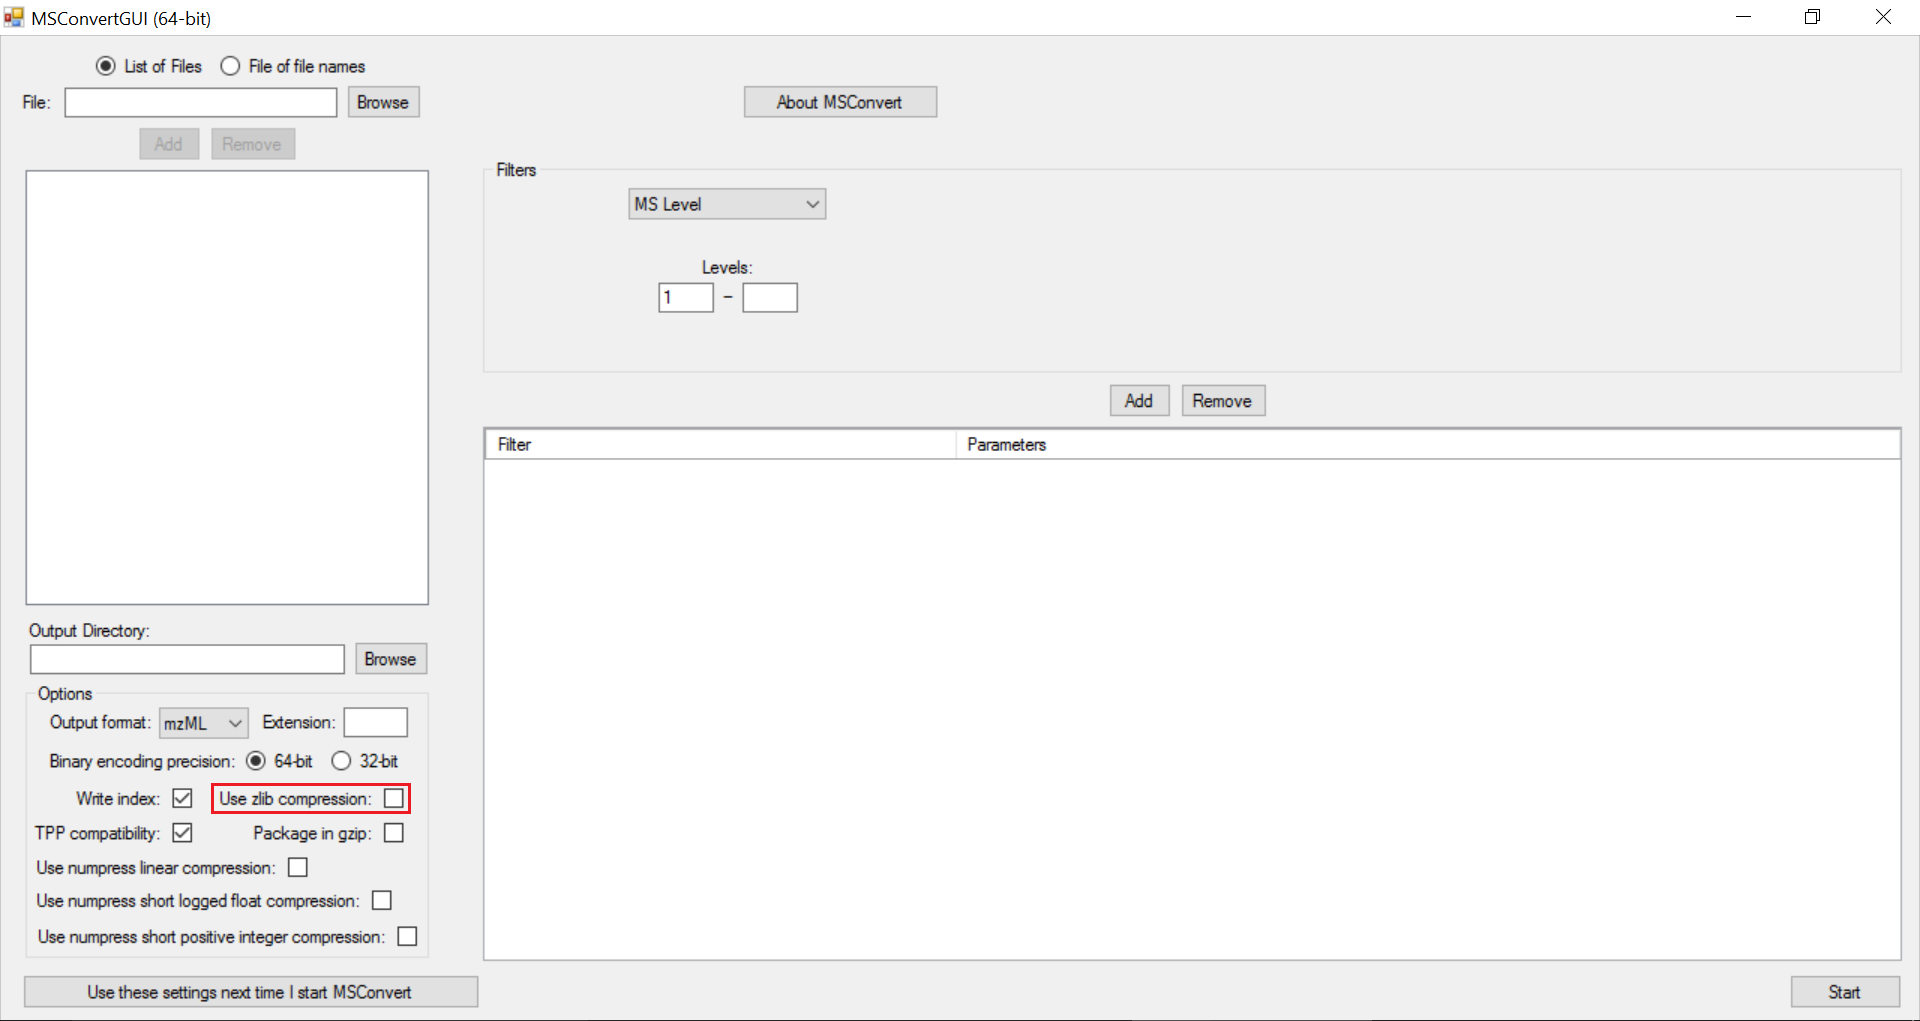
Note
zlib compression is enabled by default in msConvert. El-MAVEN in its current form does not support zlib compression. It is important to uncheck “Use zlib compression” box.
Output
msConvert can convert to an array of different formats but El-MAVEN primarily uses .mzXML and .mzML formats.
Adjust Global Settings
Global Settings can be changed from the Options dialog  . There are 9 tabs in the dialog. Each of these tabs has parameters related to a different module in El-MAVEN. For example, a tab for Instrumentation details, a tab for File Import settings etc.
The m/z option scans the groups to find any specific m/z value and plot its corresponding EIC. The +/- option to its right is to specify the expected mass resolution error in parts per million (ppm).
To know more about the functionality of different tabs and their settings, users can see the Widgets page. Please be sure to set the desired settings before processing an input file.
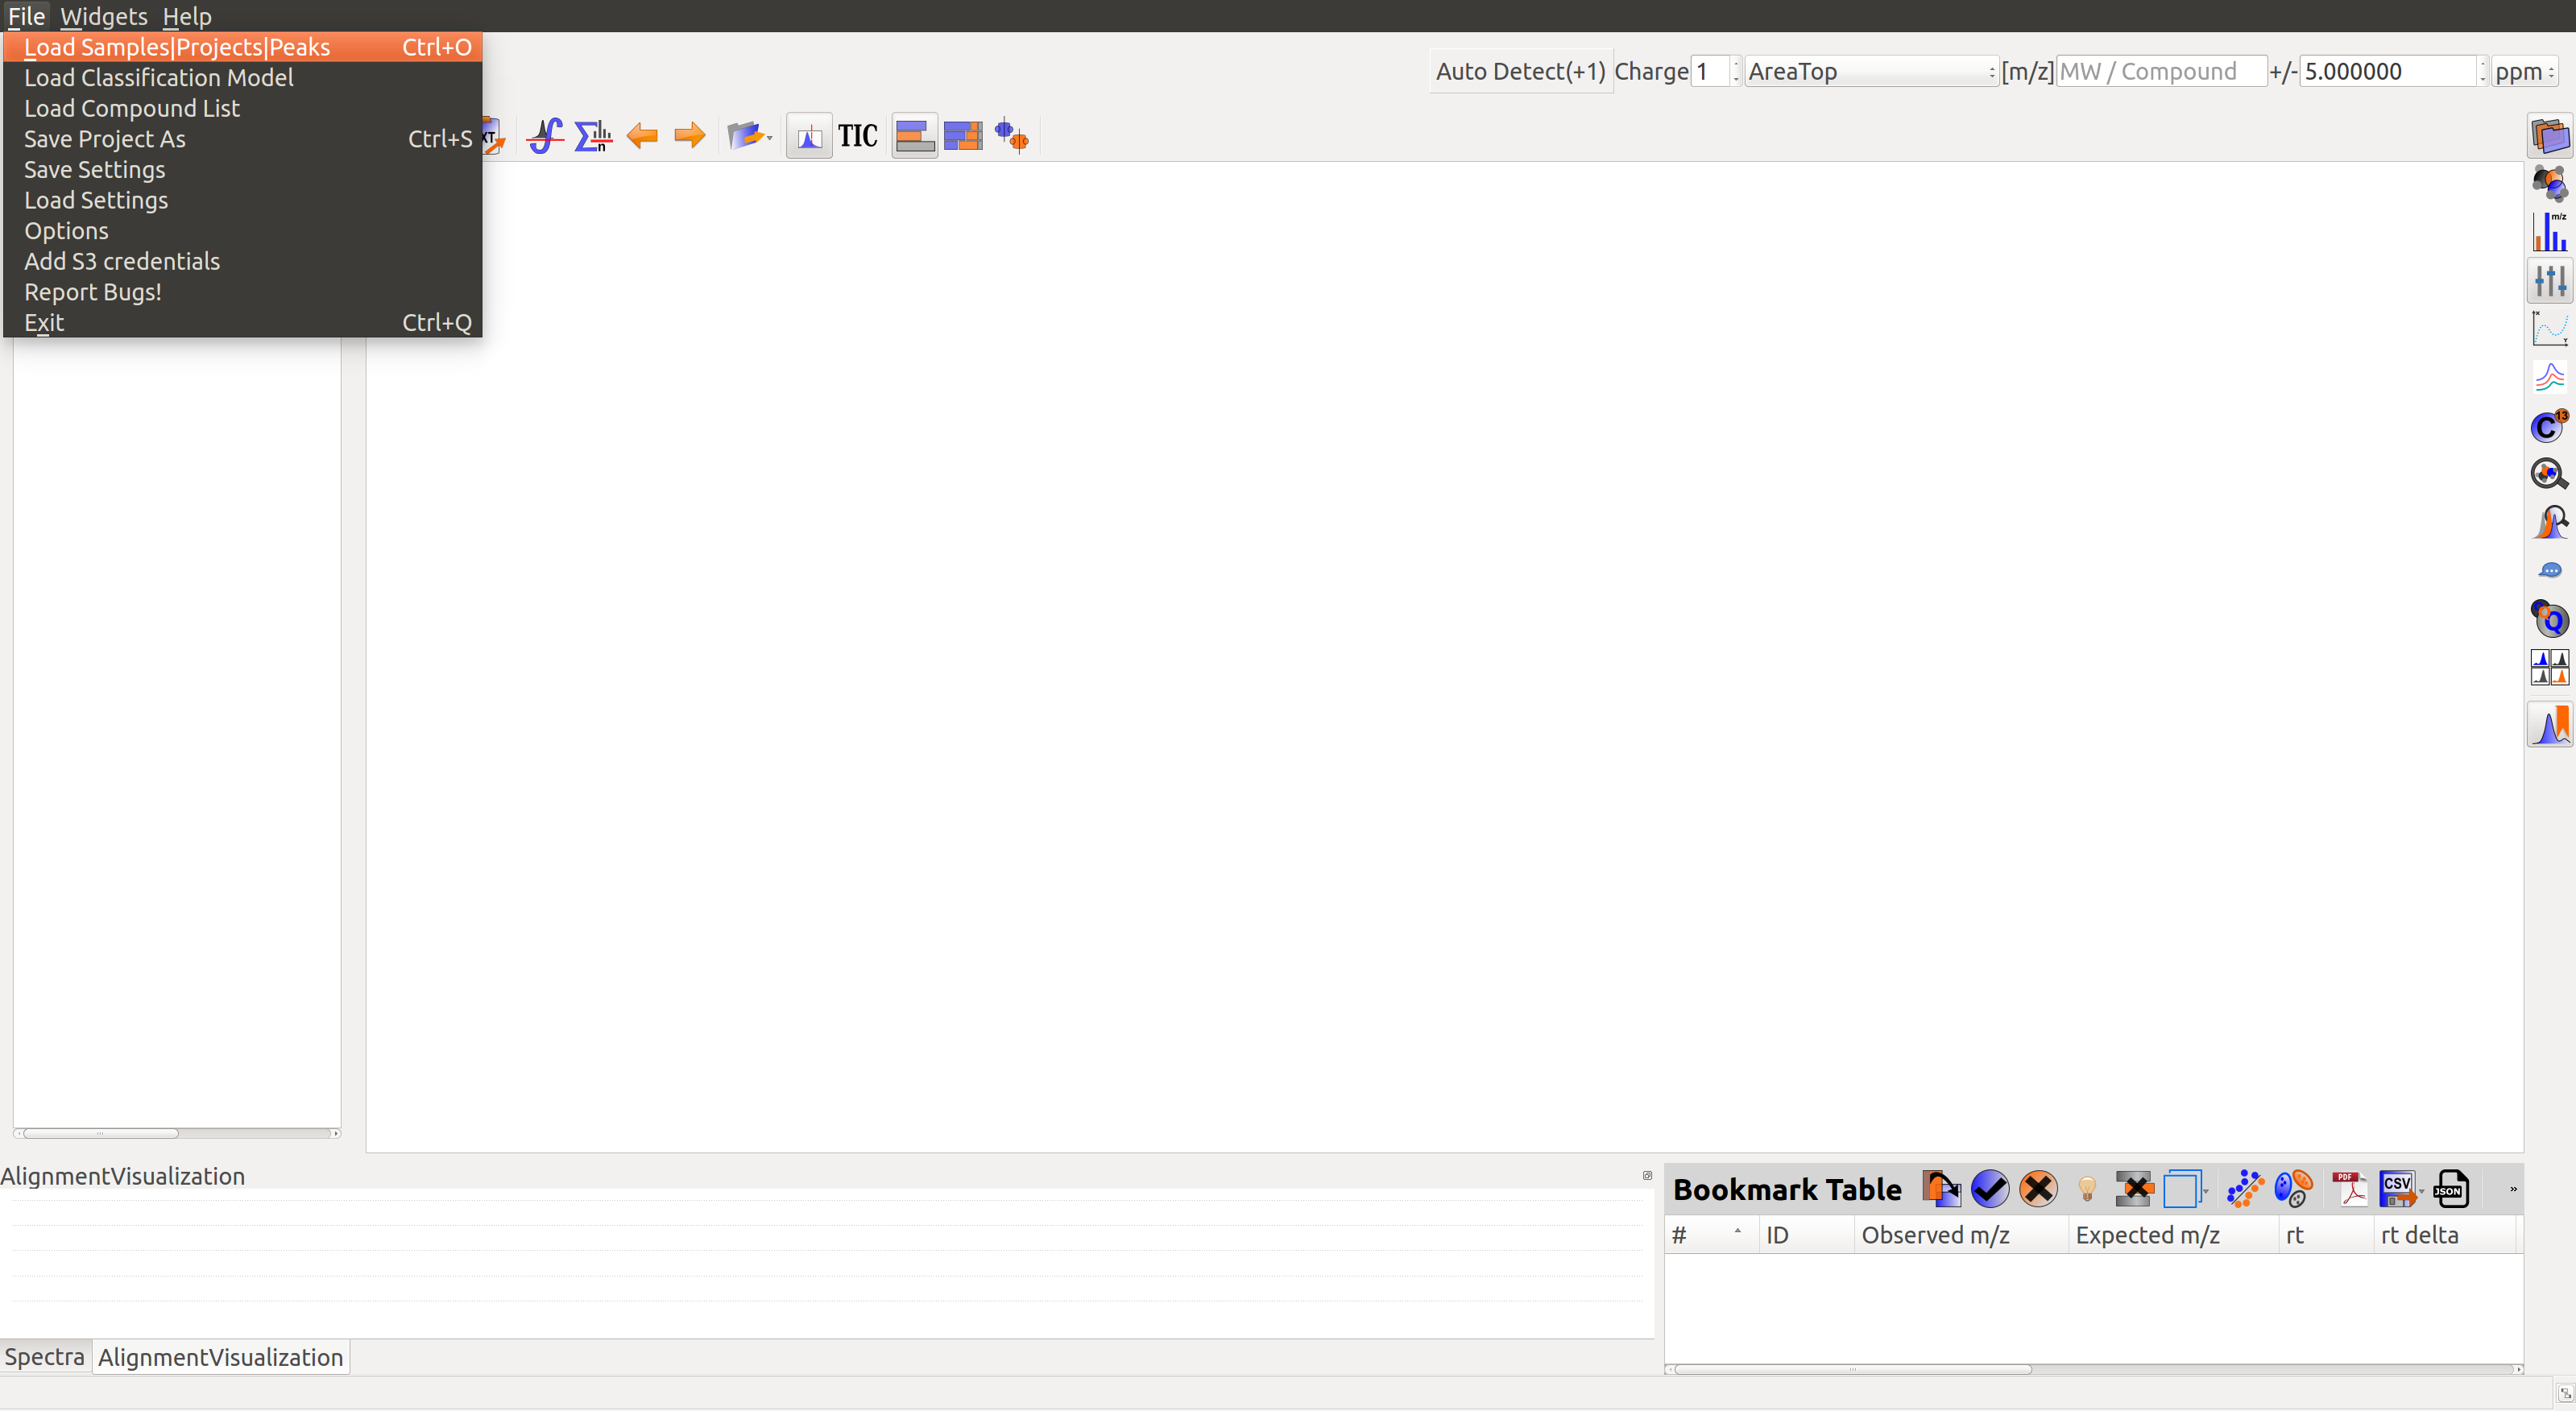
Load Samples
Users can go to File in the Menu and click on Load Samples|Projects|Peaks option. Then navigate to the folder containing the sample data, select all .mzXML or .mzML files and click Open. A loading bar displays the progress at the bottom.
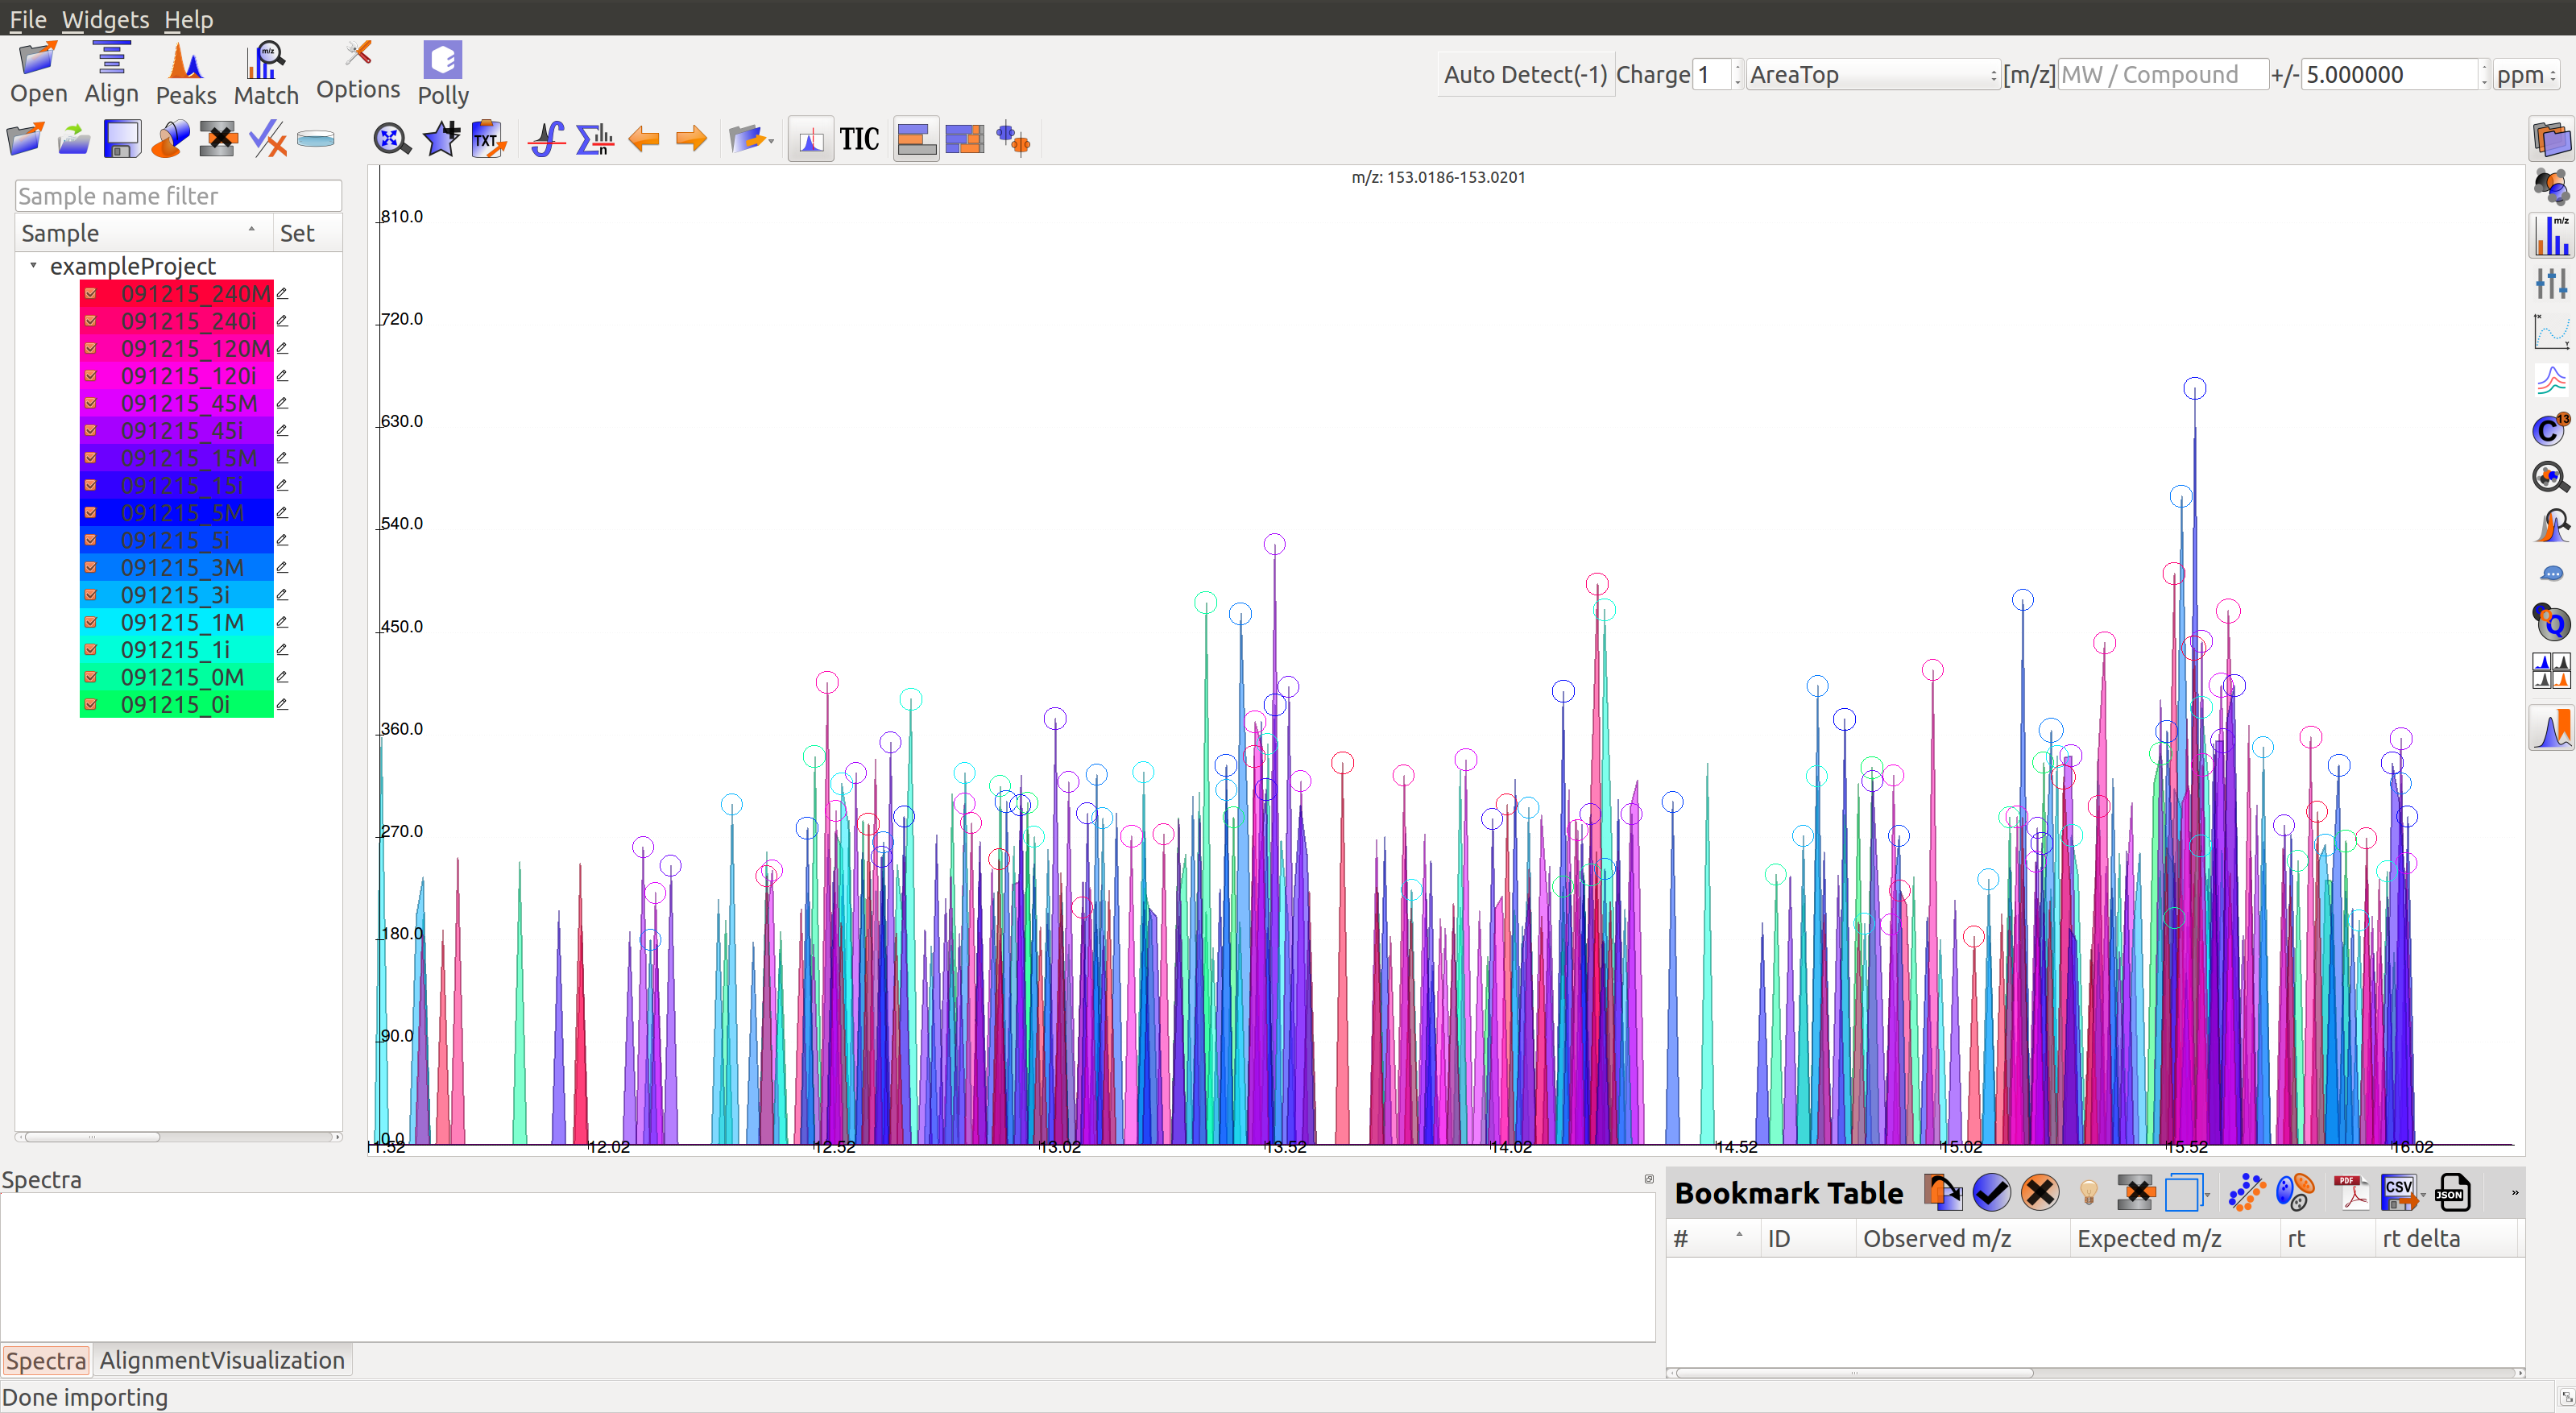
When the samples have loaded, users should see a sample panel on the left side. If it is not displayed automatically, click on the Show Samples Widget button on the toolbar. El-MAVEN automatically assigns a color to every sample. Users can select/deselect any sample by clicking the checkbox on the left of the sample name.
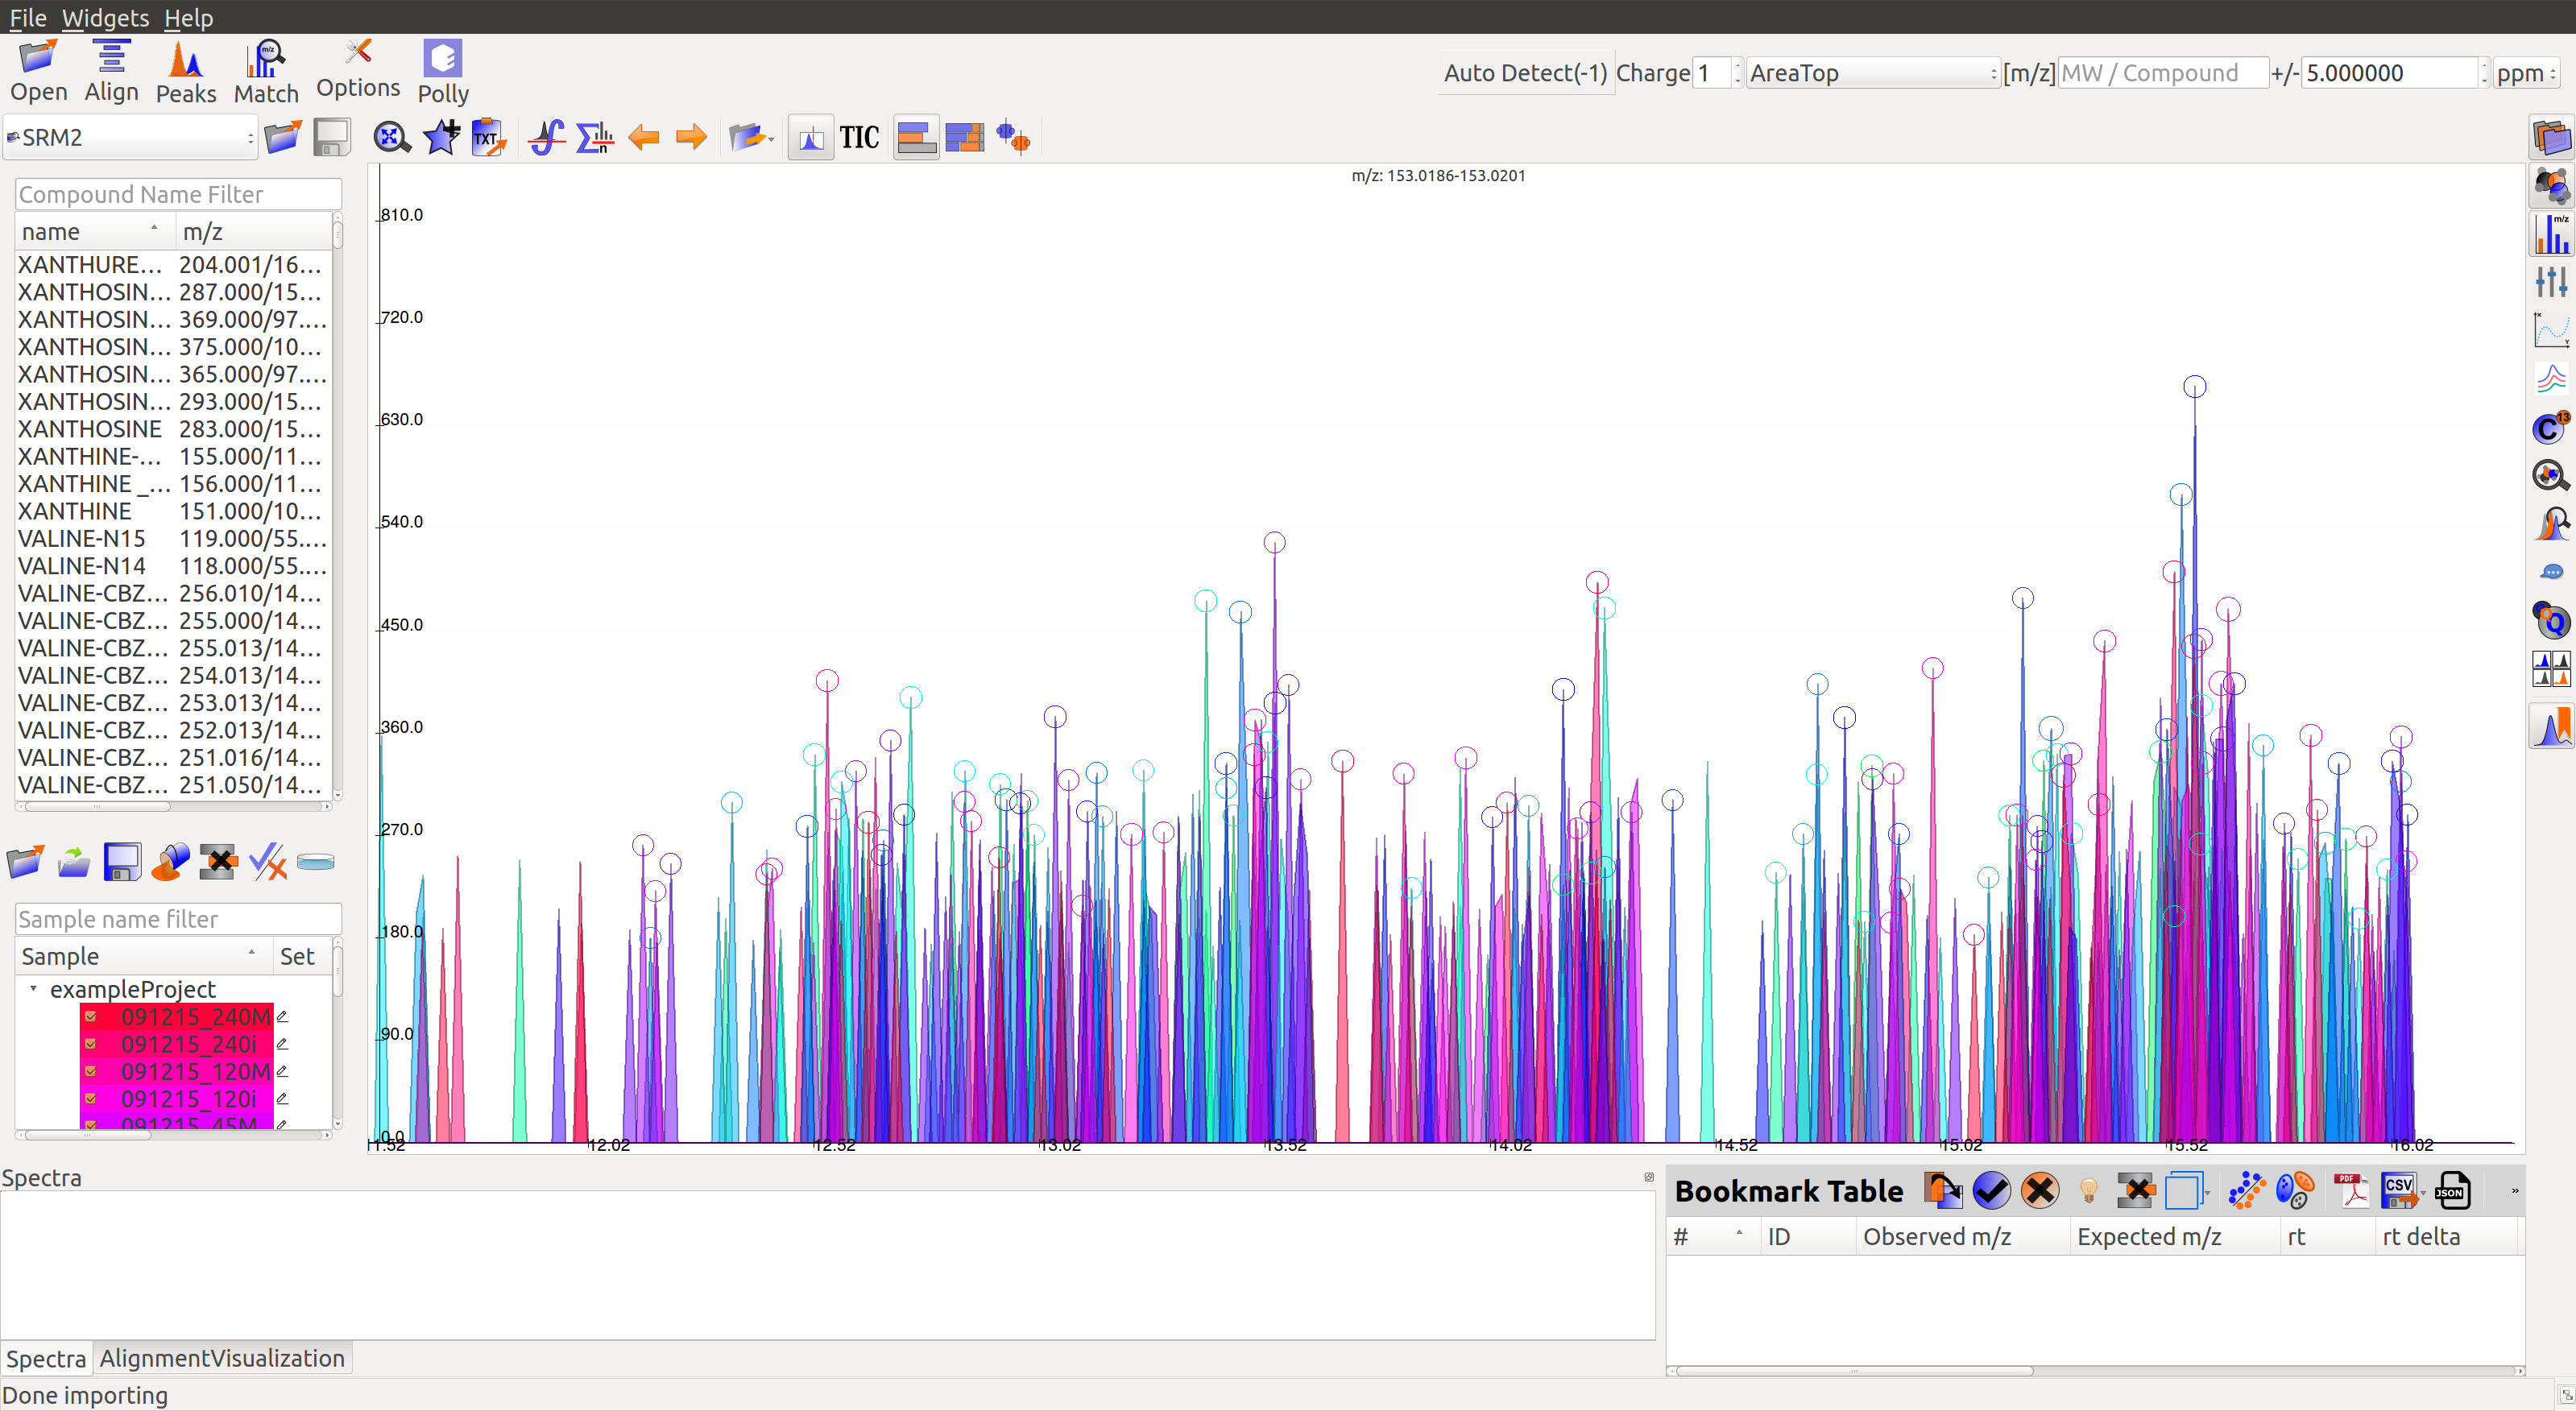
Load Compound Database
Users can click on Compounds option in the leftmost menu, navigate to the folder containing the standard database file, select the appropriate .csv file and click Open. Alternatively, users may use any of the default files loaded on start-up.
This is a sample Compound Database:
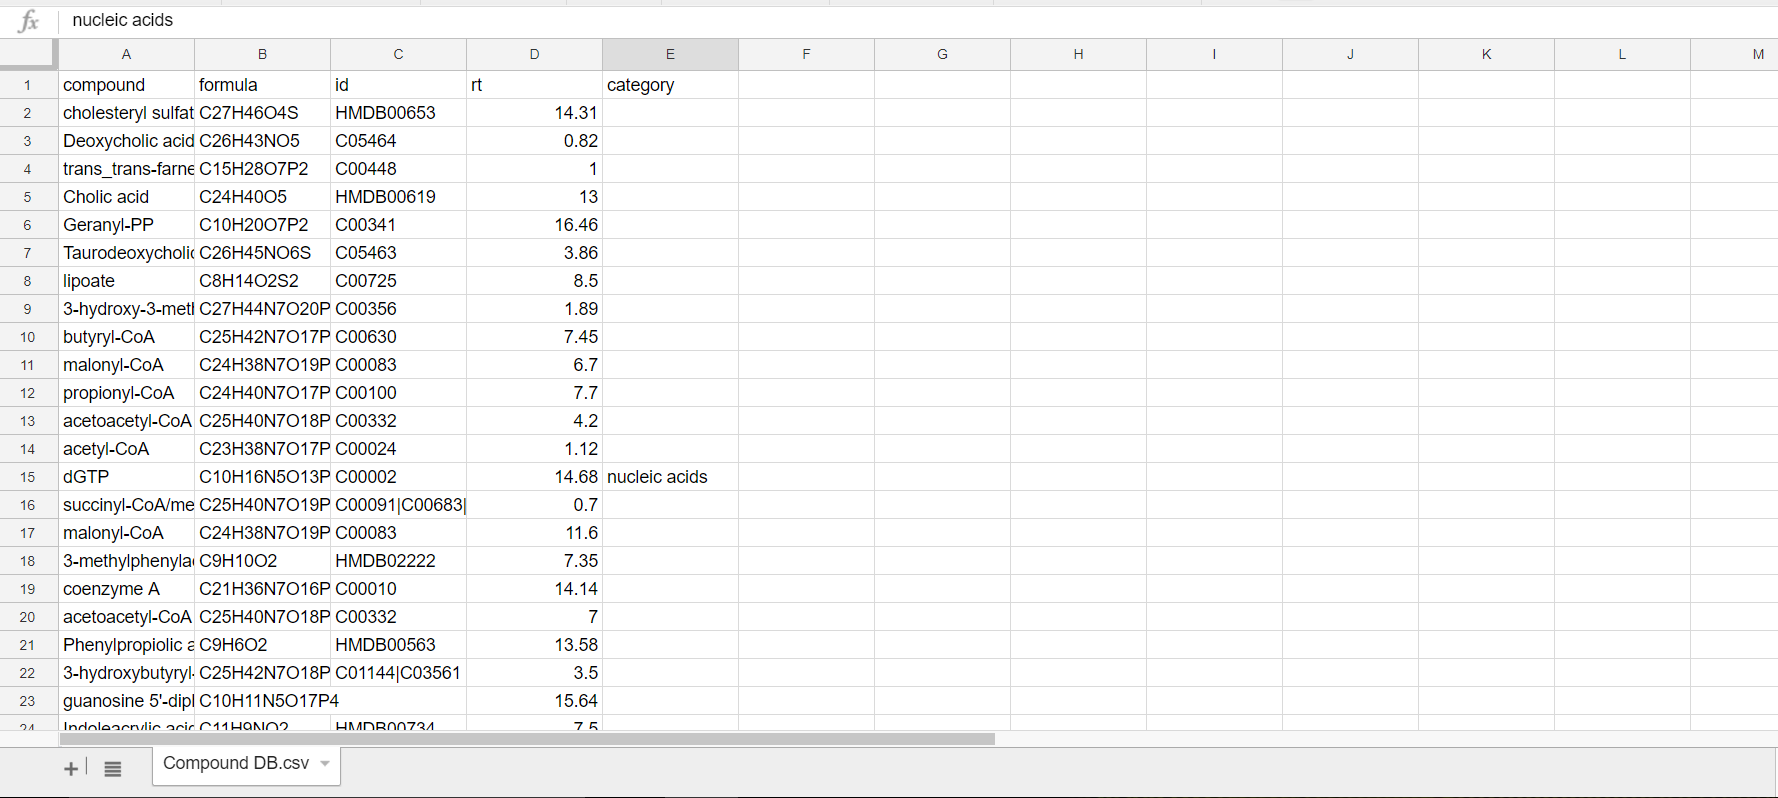
It lists all metabolite names, chemical formula, HMDB ID, and the class/category of compounds they belong to (if known).
Mark Blanks
Users can mark the blanks by selecting the blank samples from the list on screen, and clicking on the Set as a Blank Sample icon  in Samples menu.
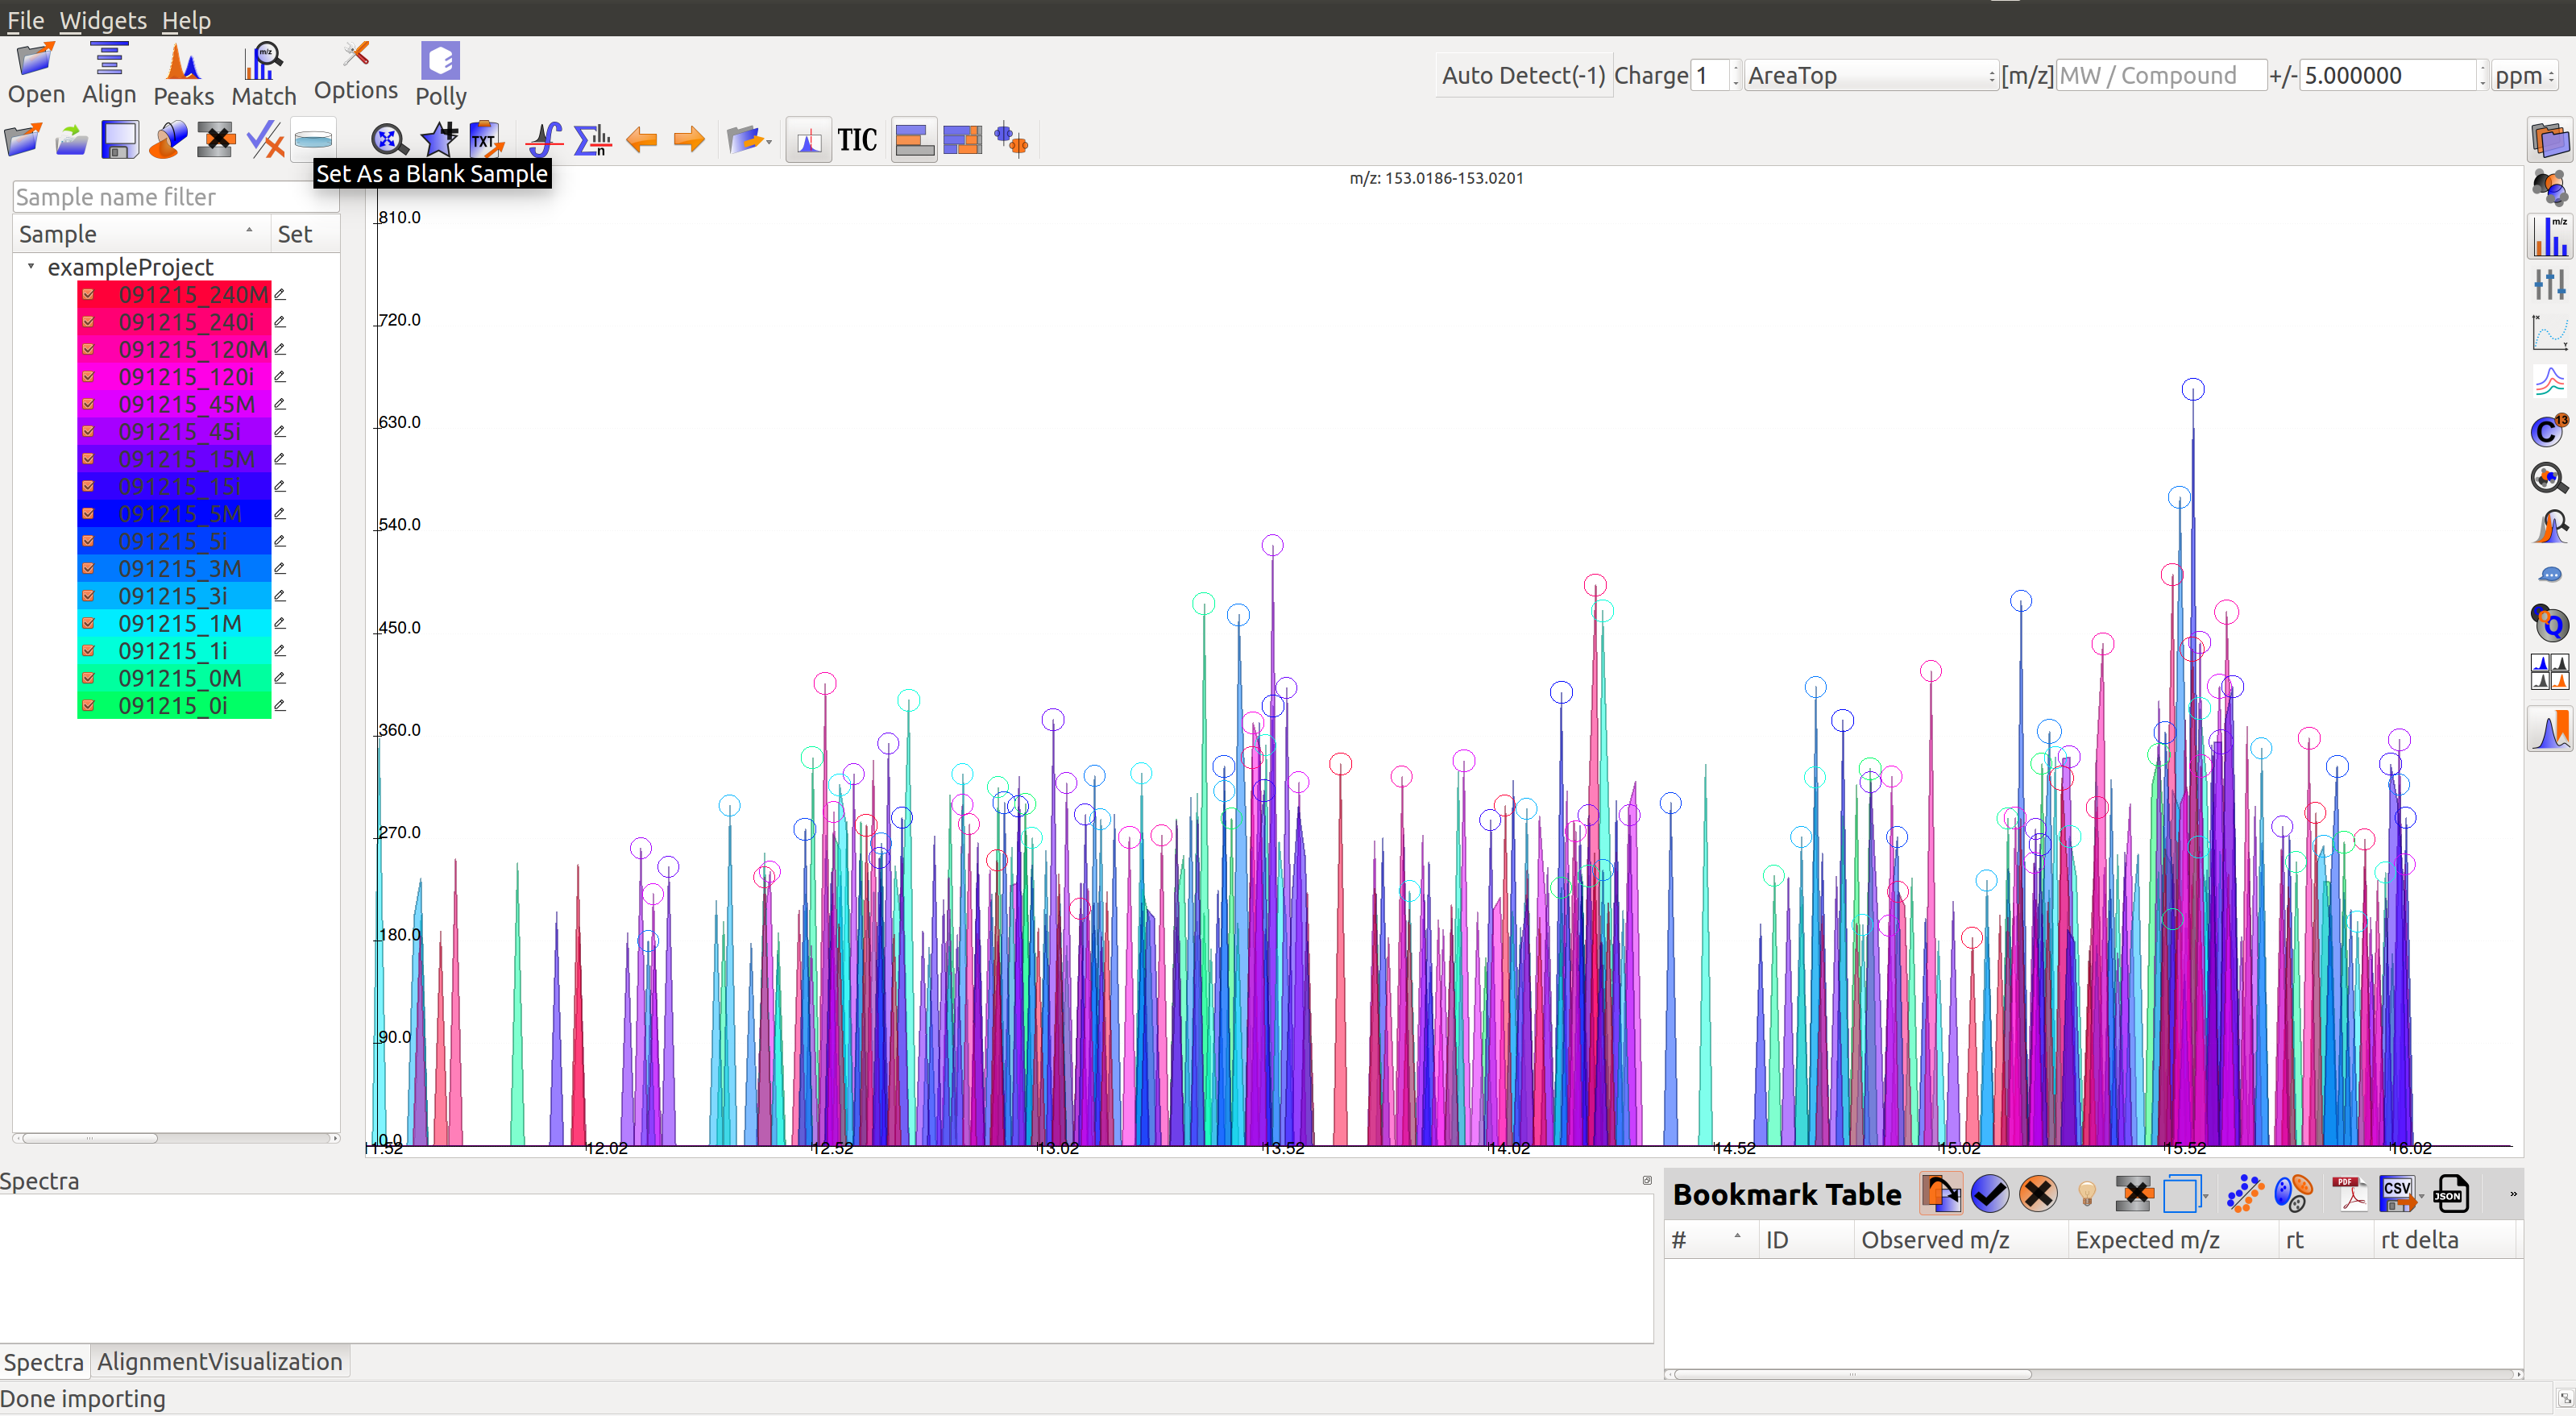
Multiple blanks can be marked together. The blanks will appear black as shown in the image below:
Alignment
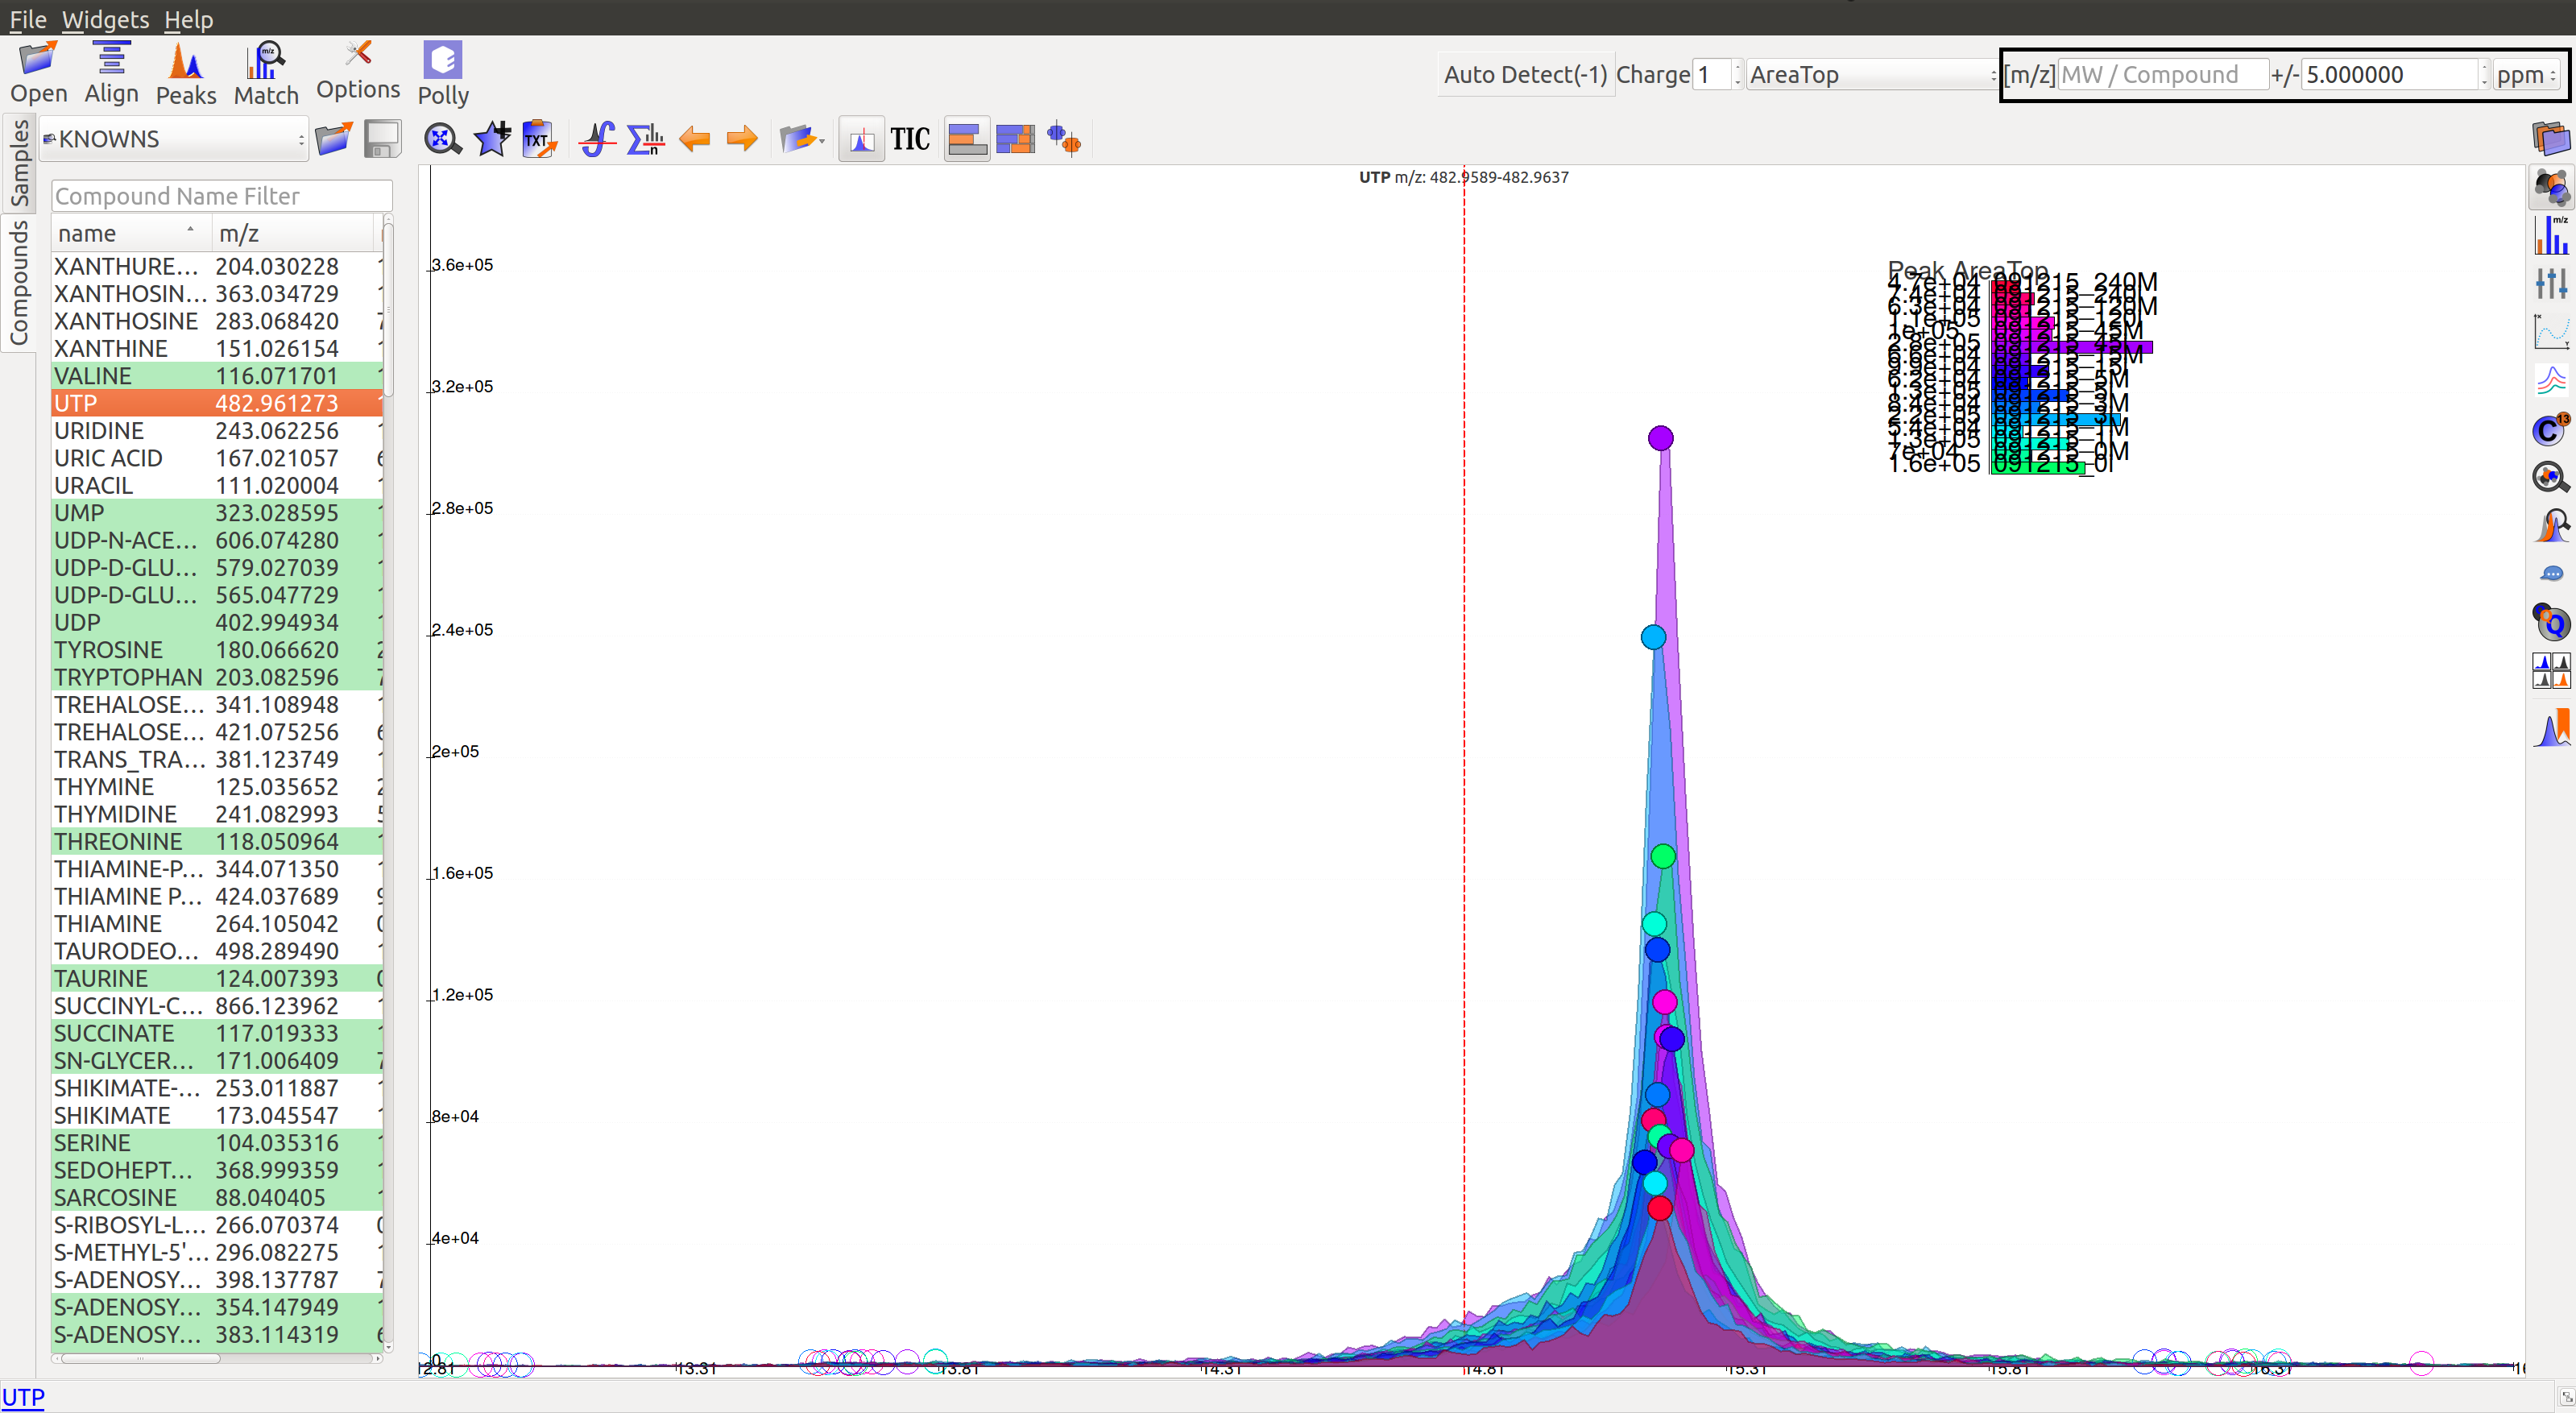
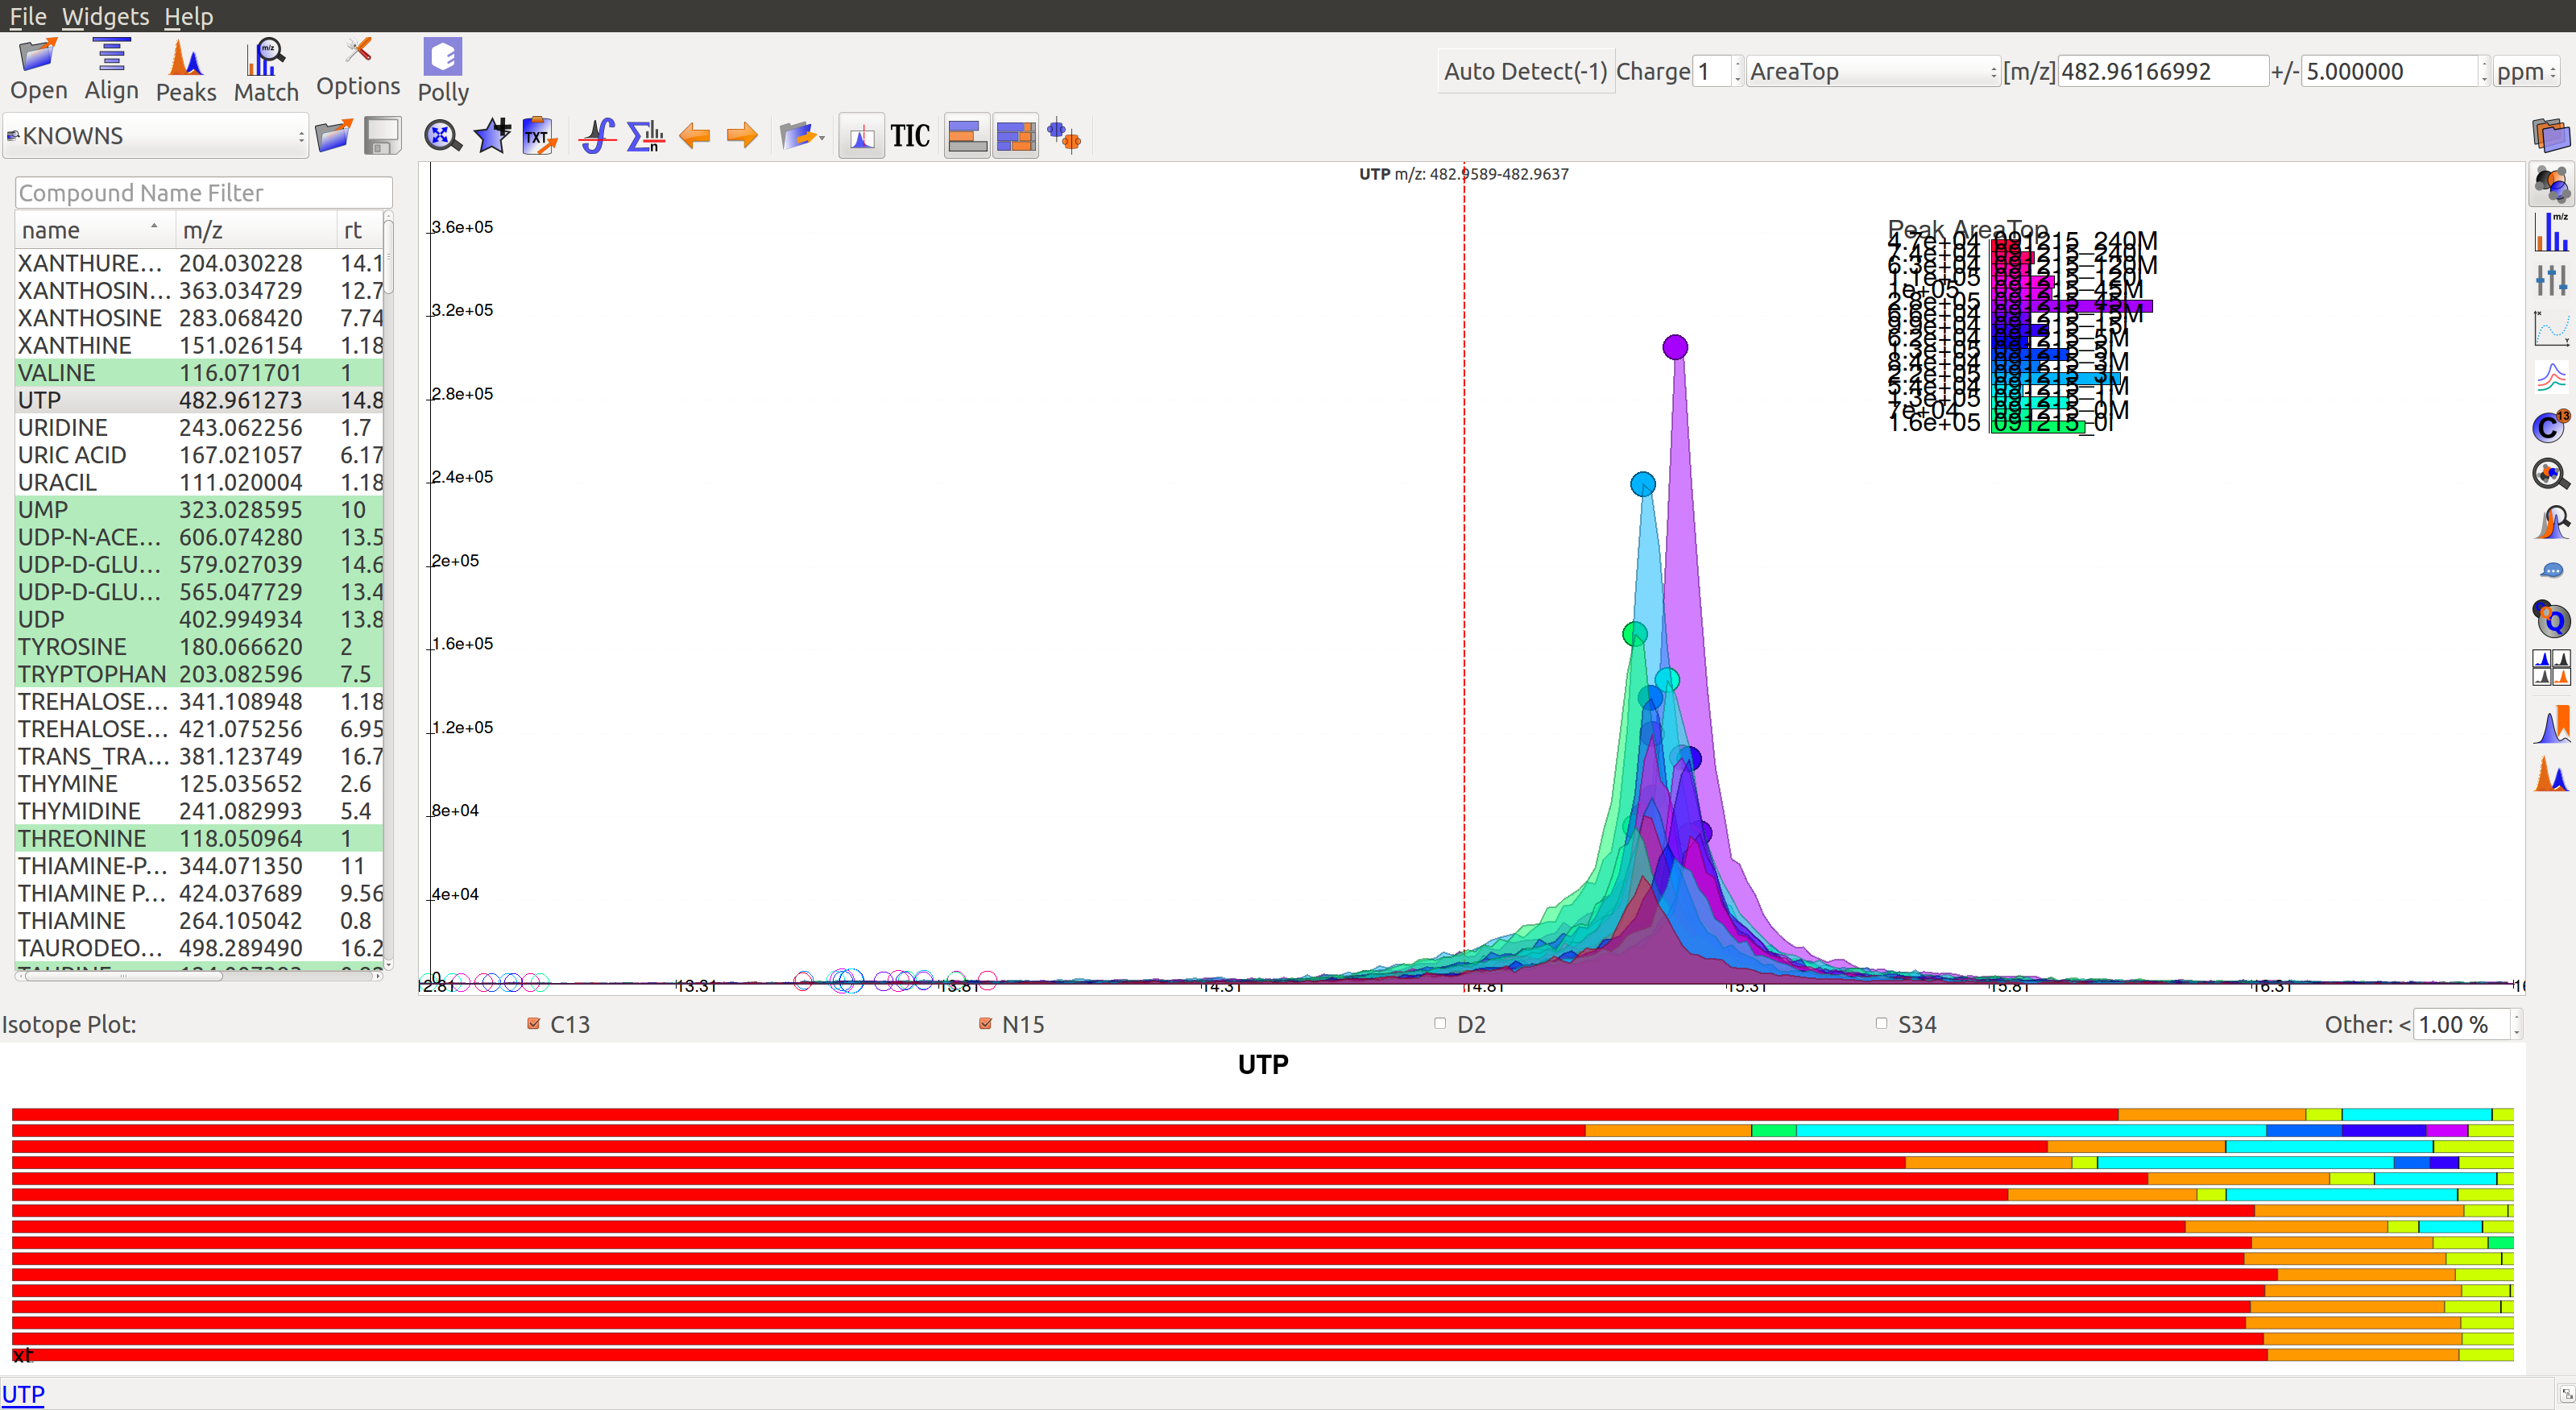
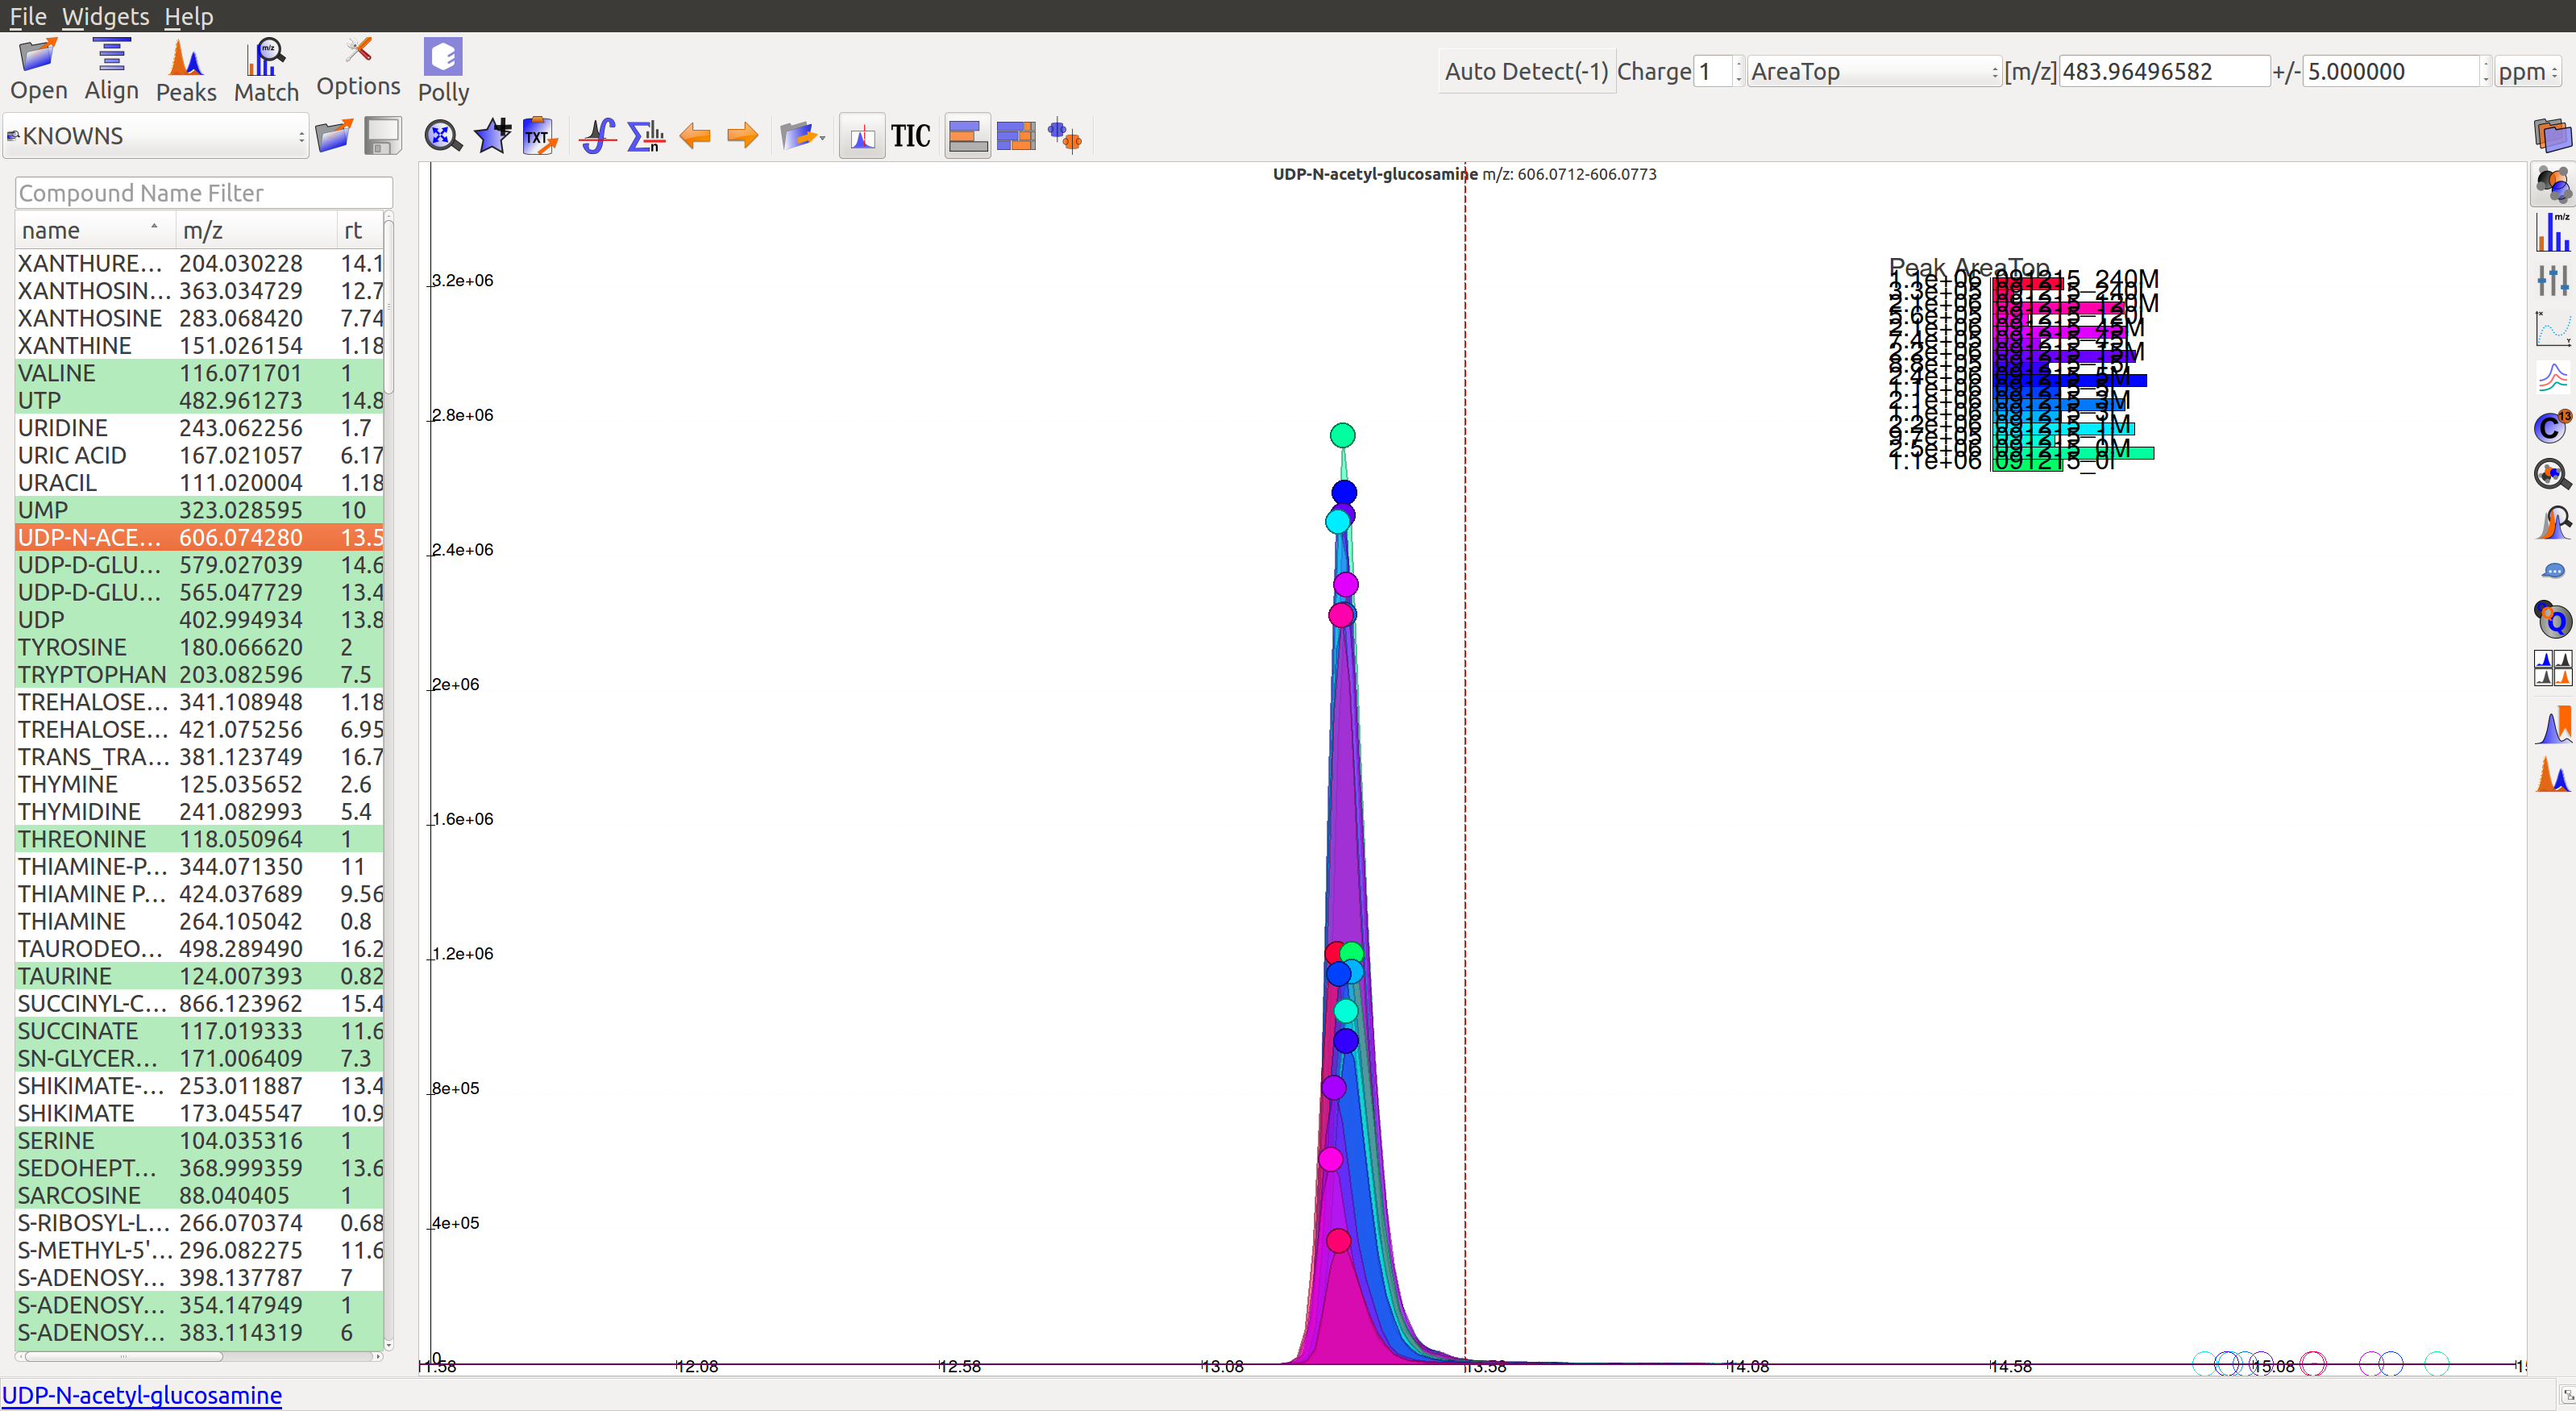
Prolonged use of the LC column can lead to a drift in retention time across samples. Alignment shifts the peak retention time in every sample to correct for this drift and brings the peaks closer to median retention time of the group.
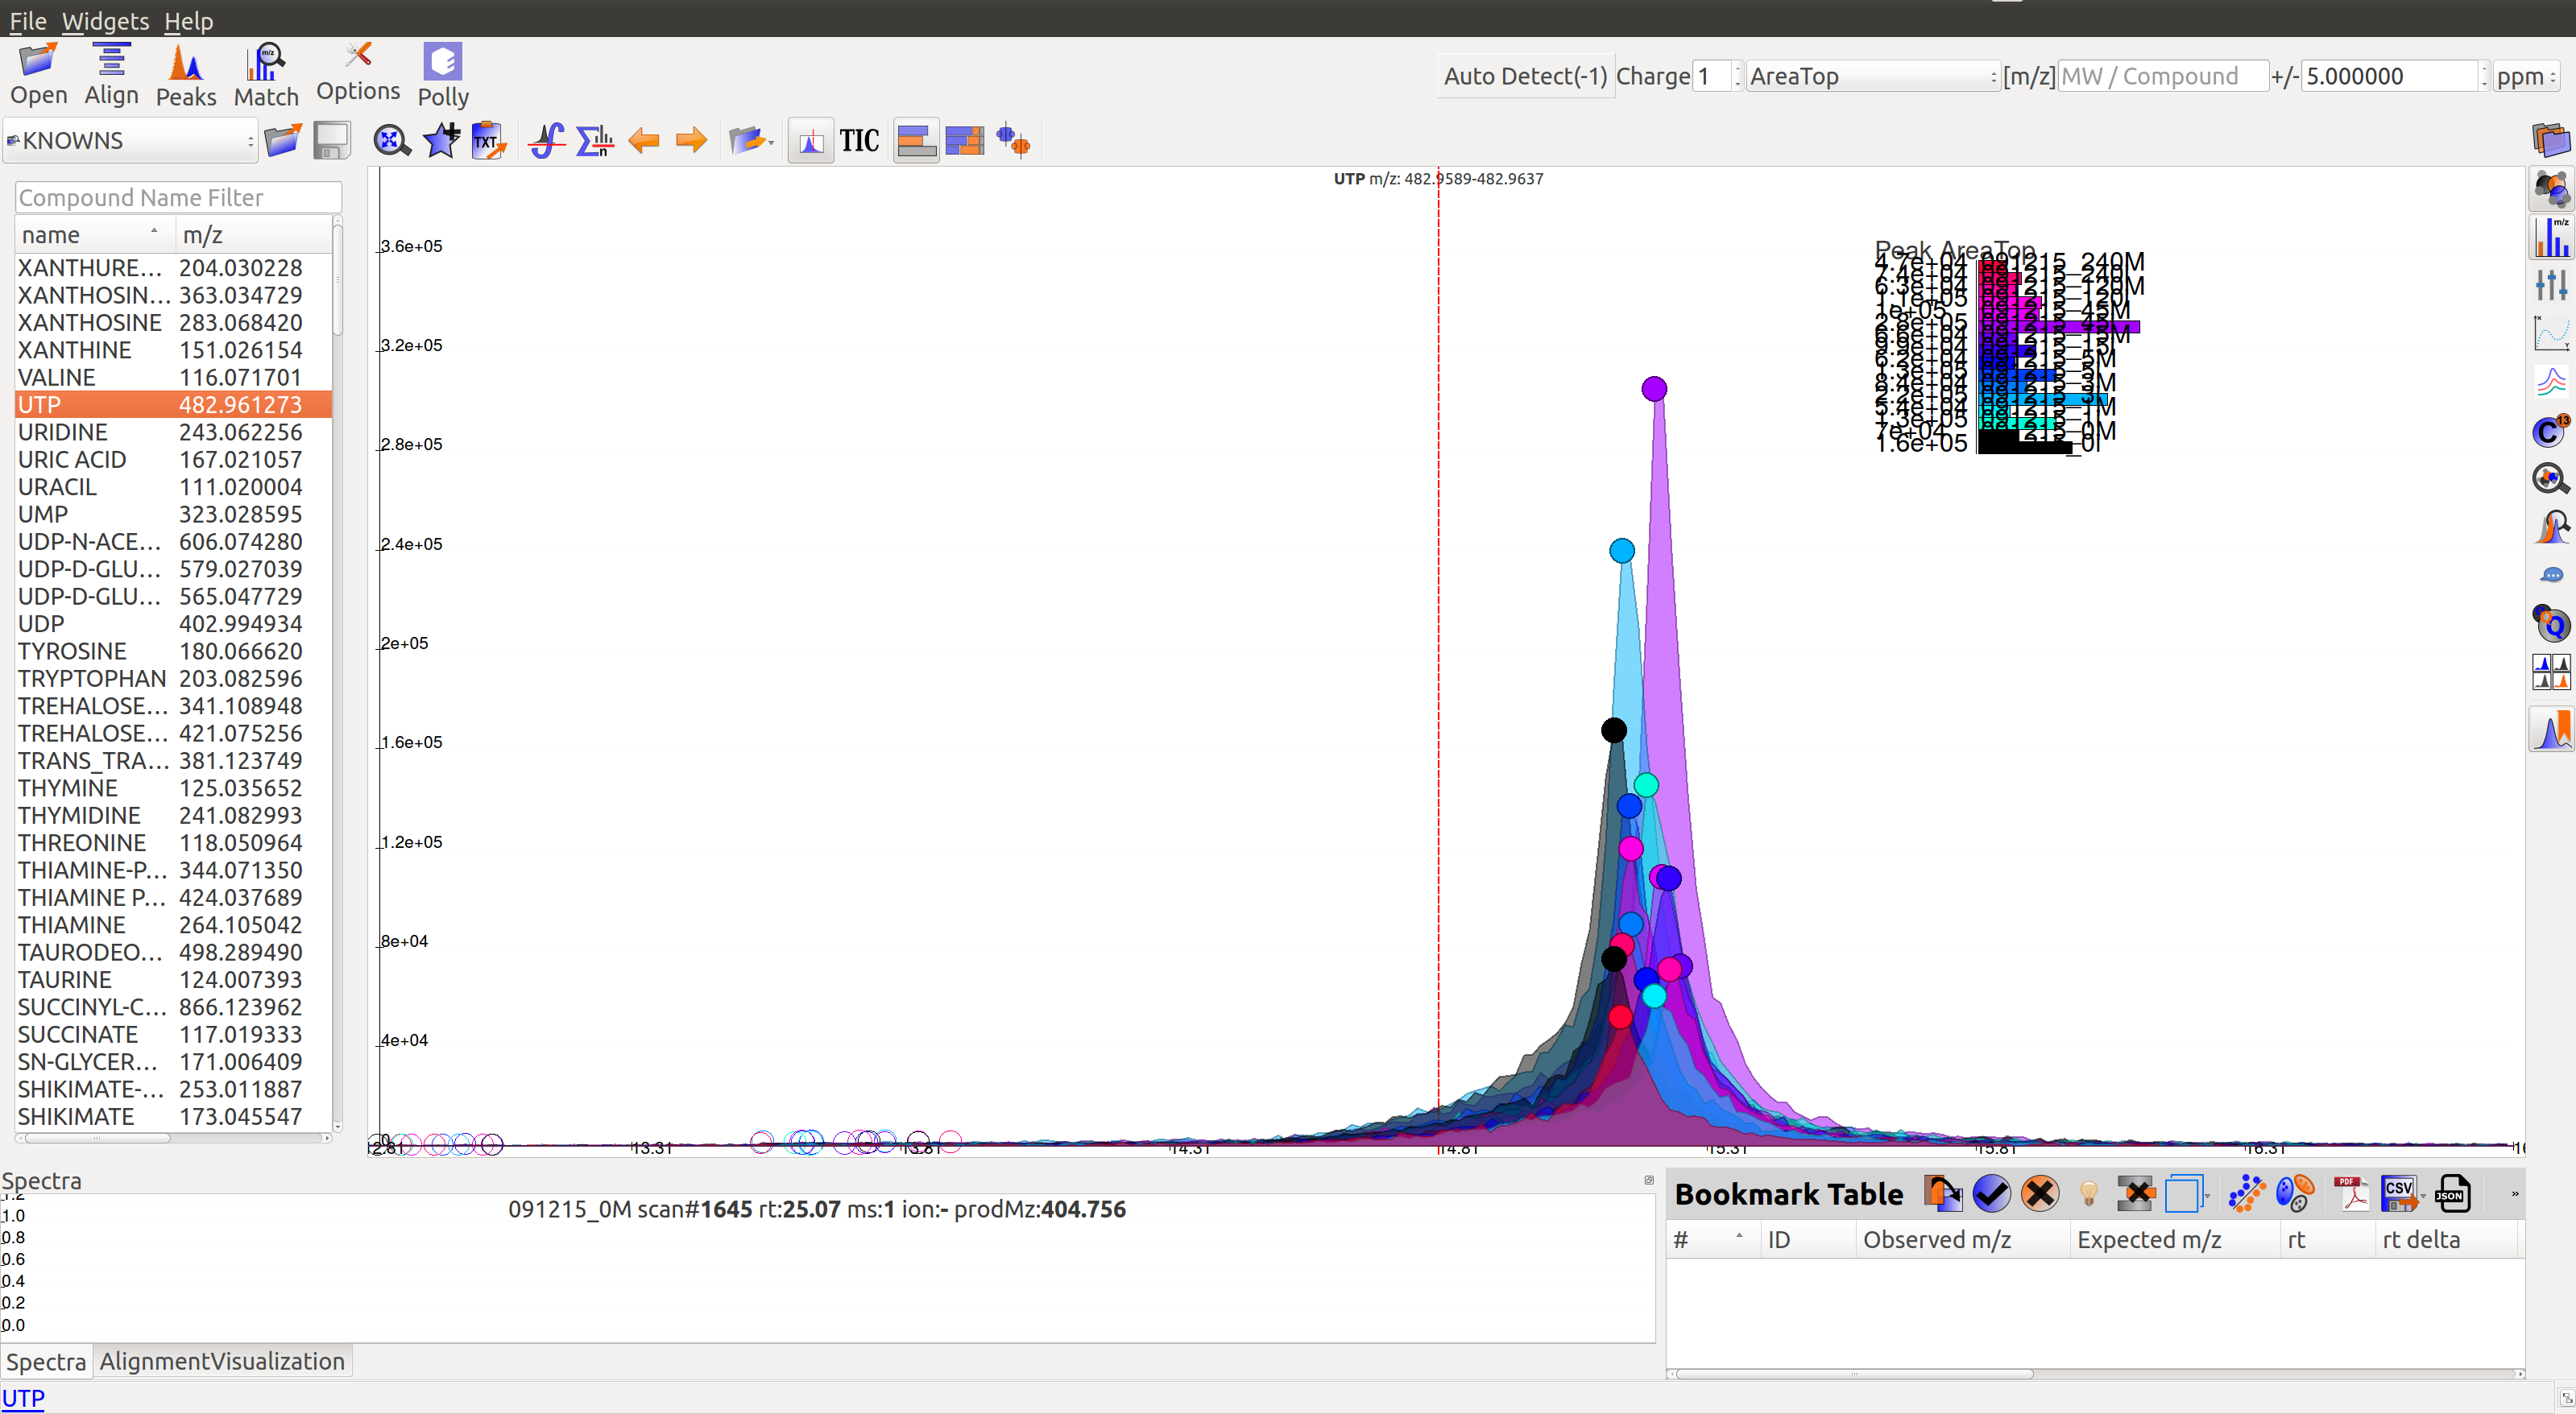
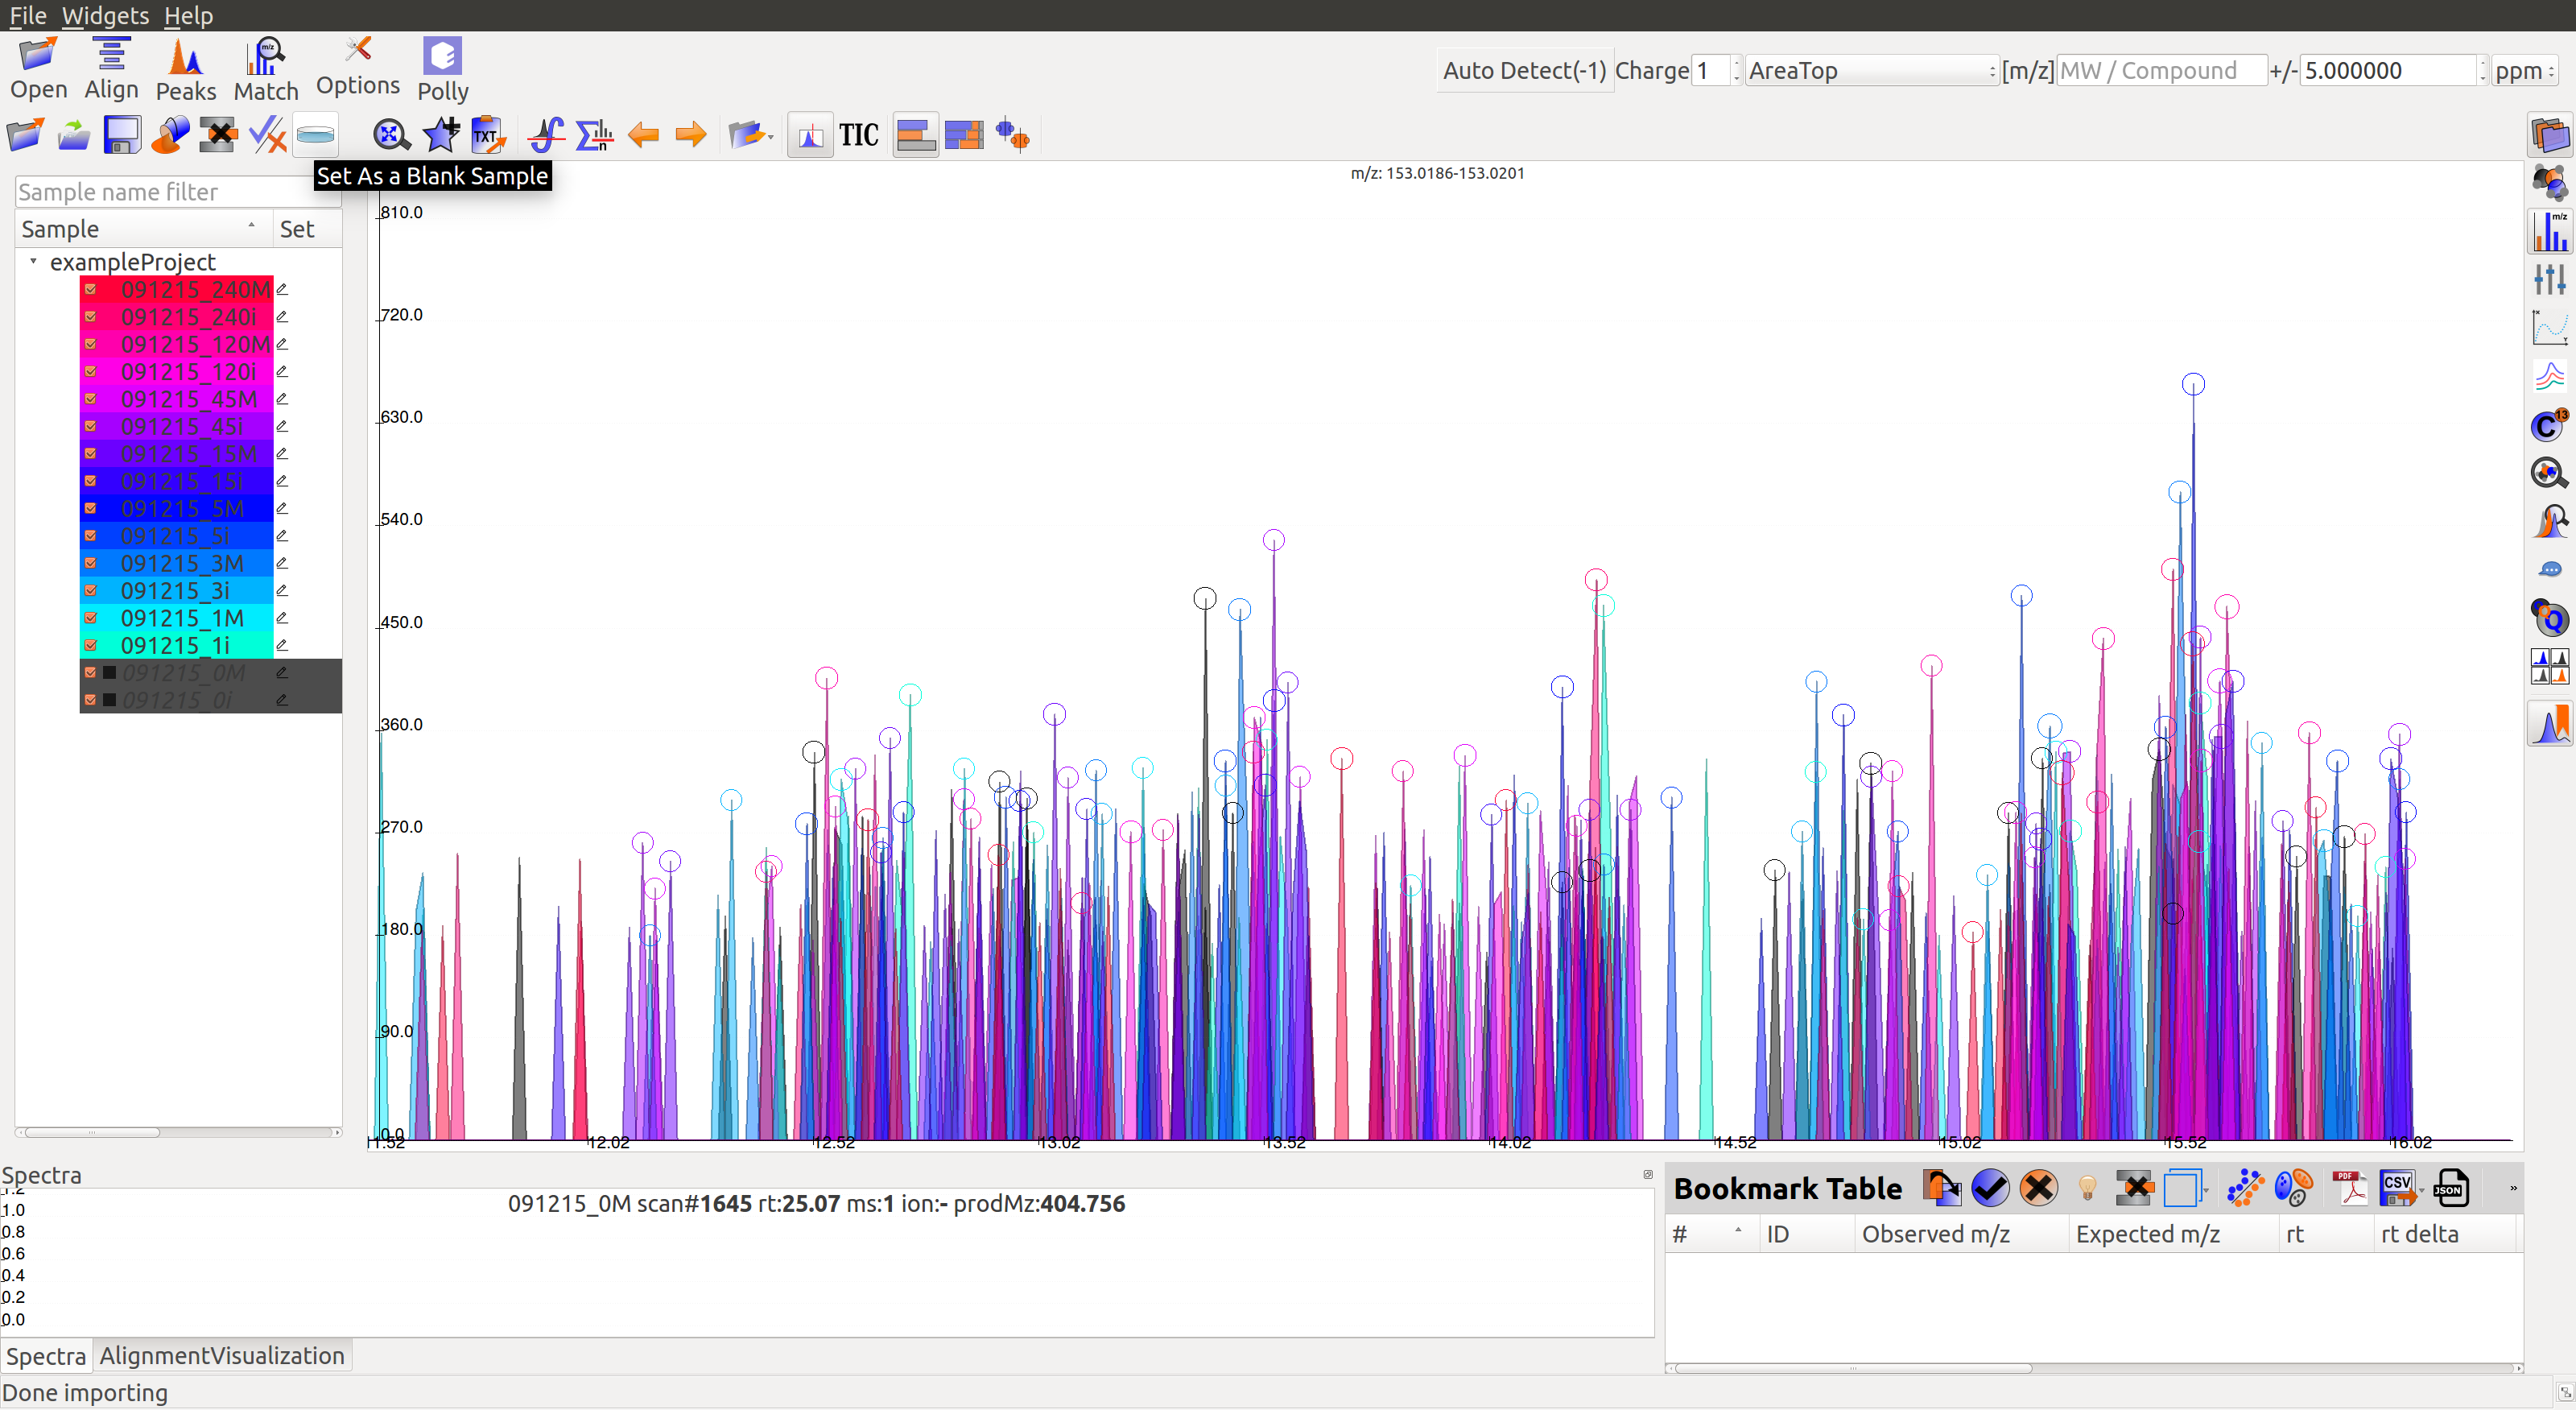
In the above image, EIC for a UTP group is displayed. If the samples were aligned, all peaks would lie at the same retention time. Since this is not the case, the samples need to be aligned.
Alignment visualization  can be used to judge the extent of deviation from median retention time.
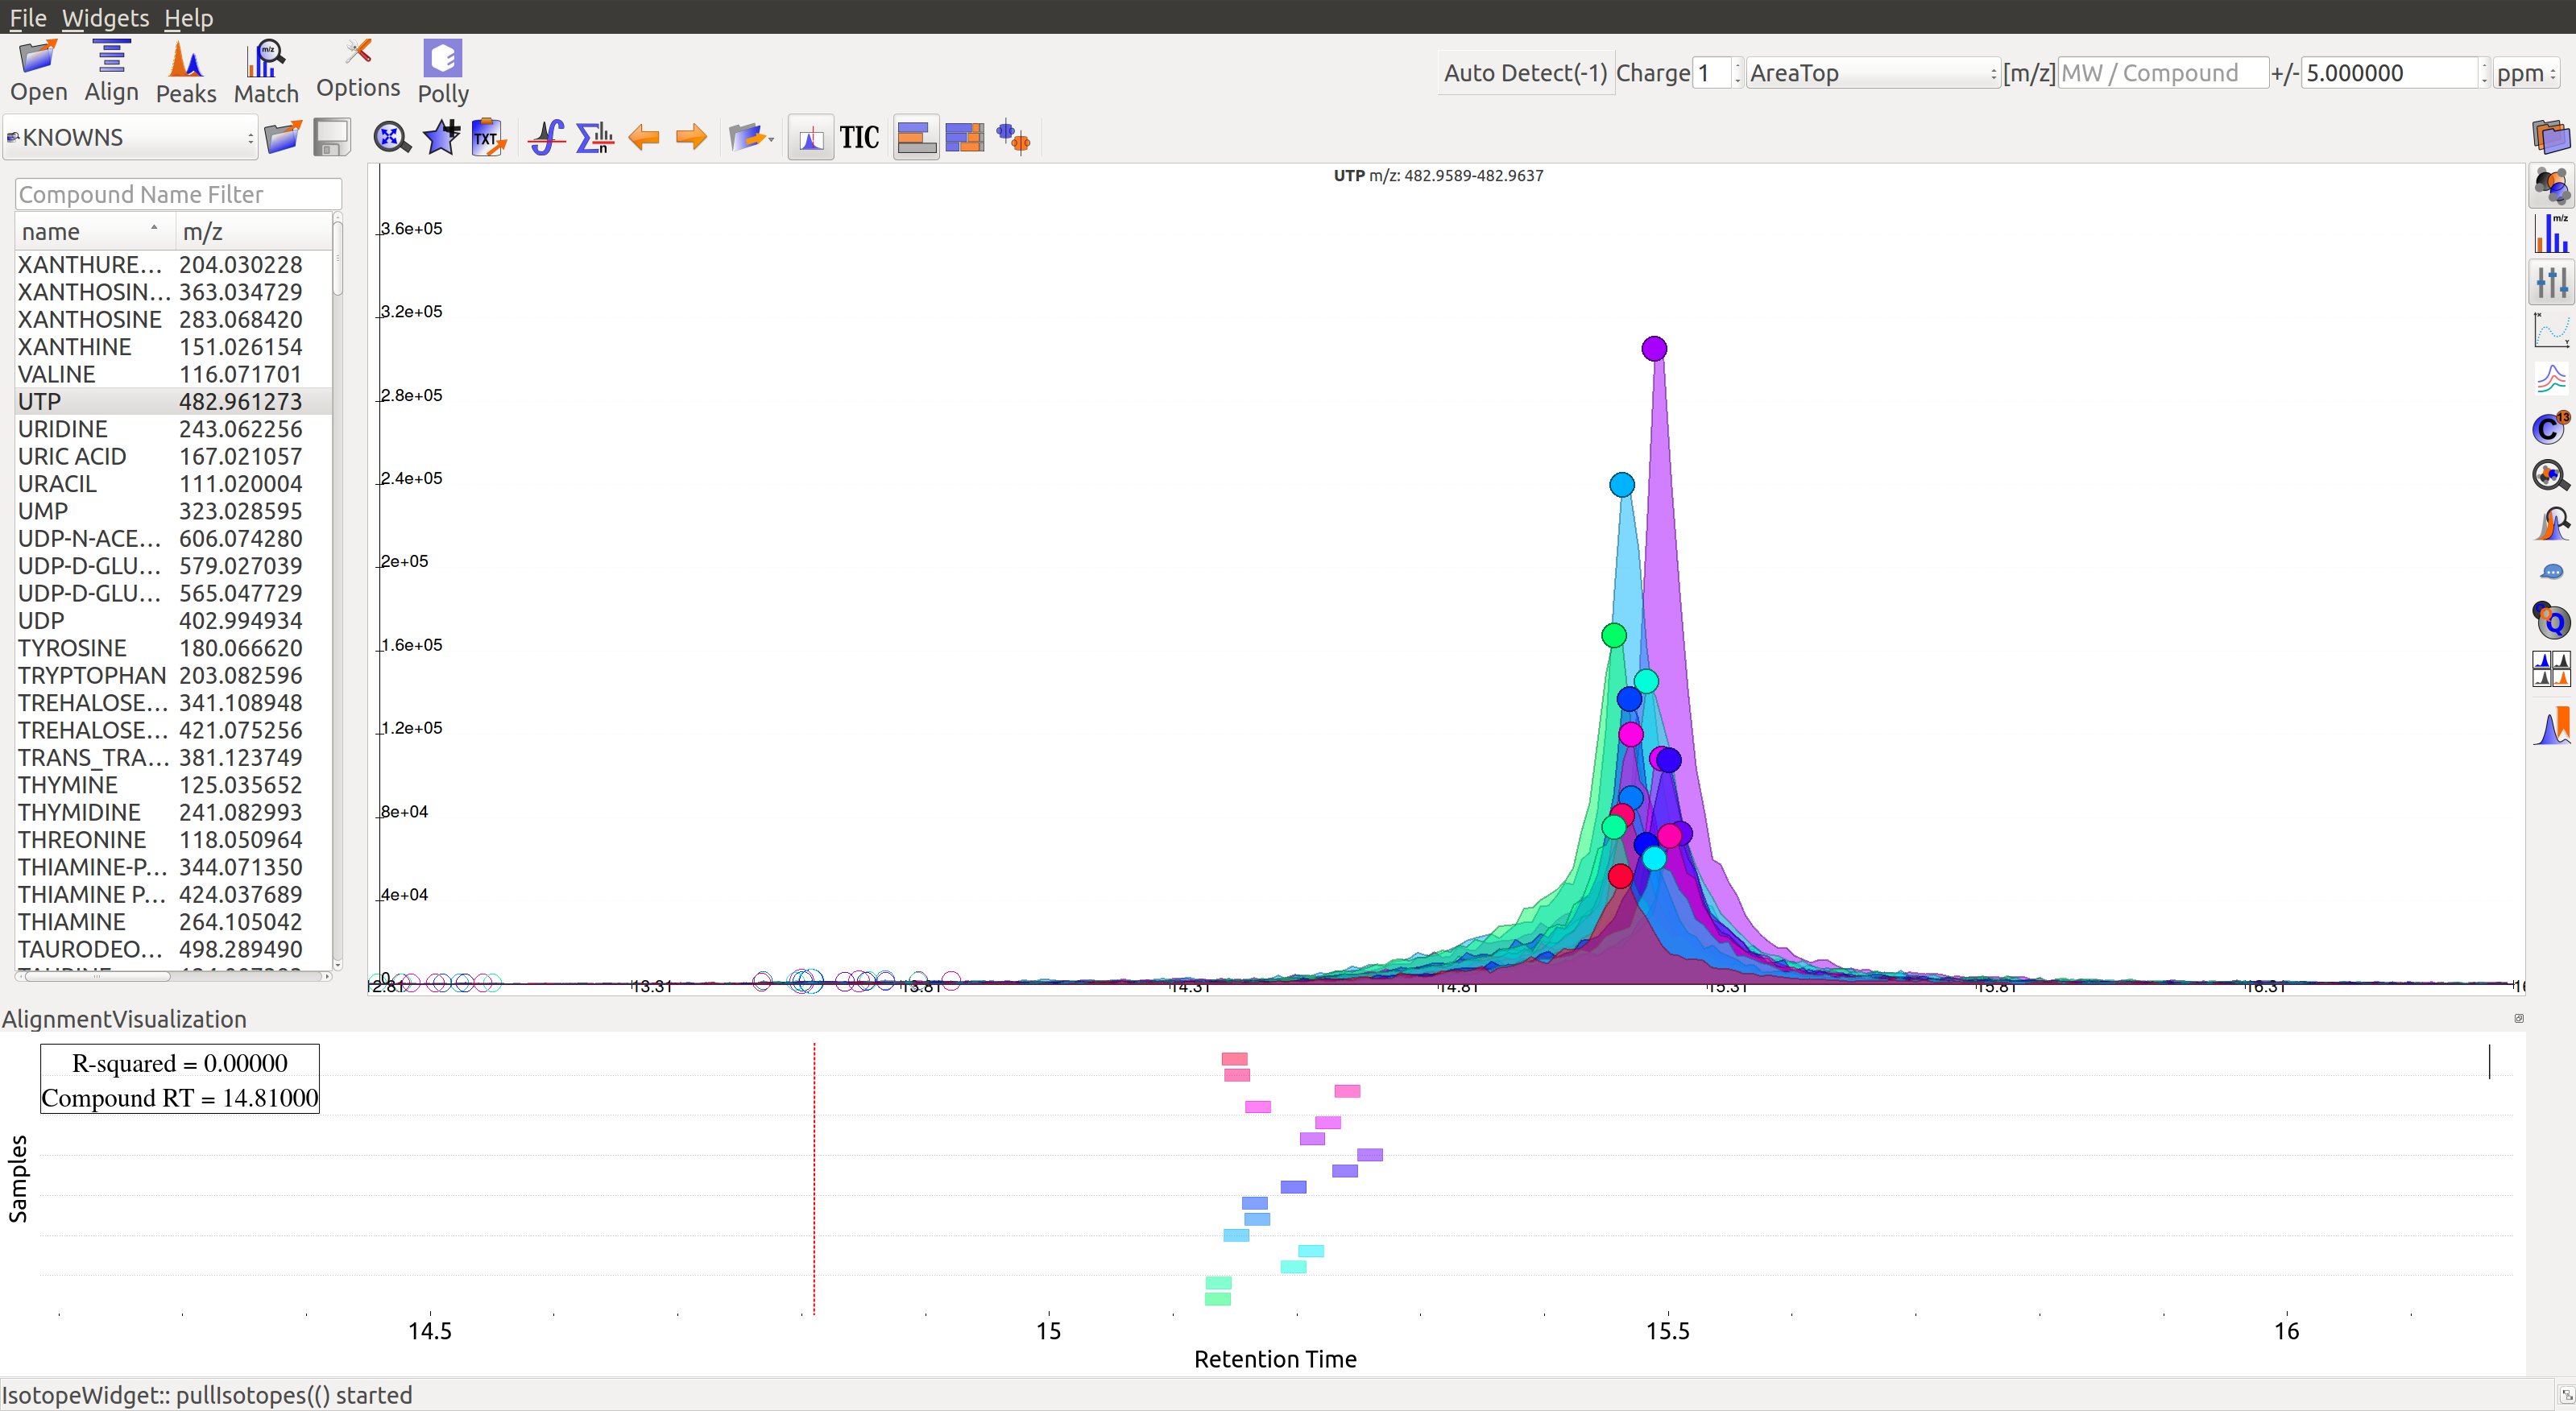
In the above visualization, each box represents a peak from the selected group at its current retention time. Samples are said to be perfectly aligned when all peak boxes lie on the same vertical axis. The peaks are considerably scattered in the above image and therefore the samples should be aligned for better grouping of peaks.
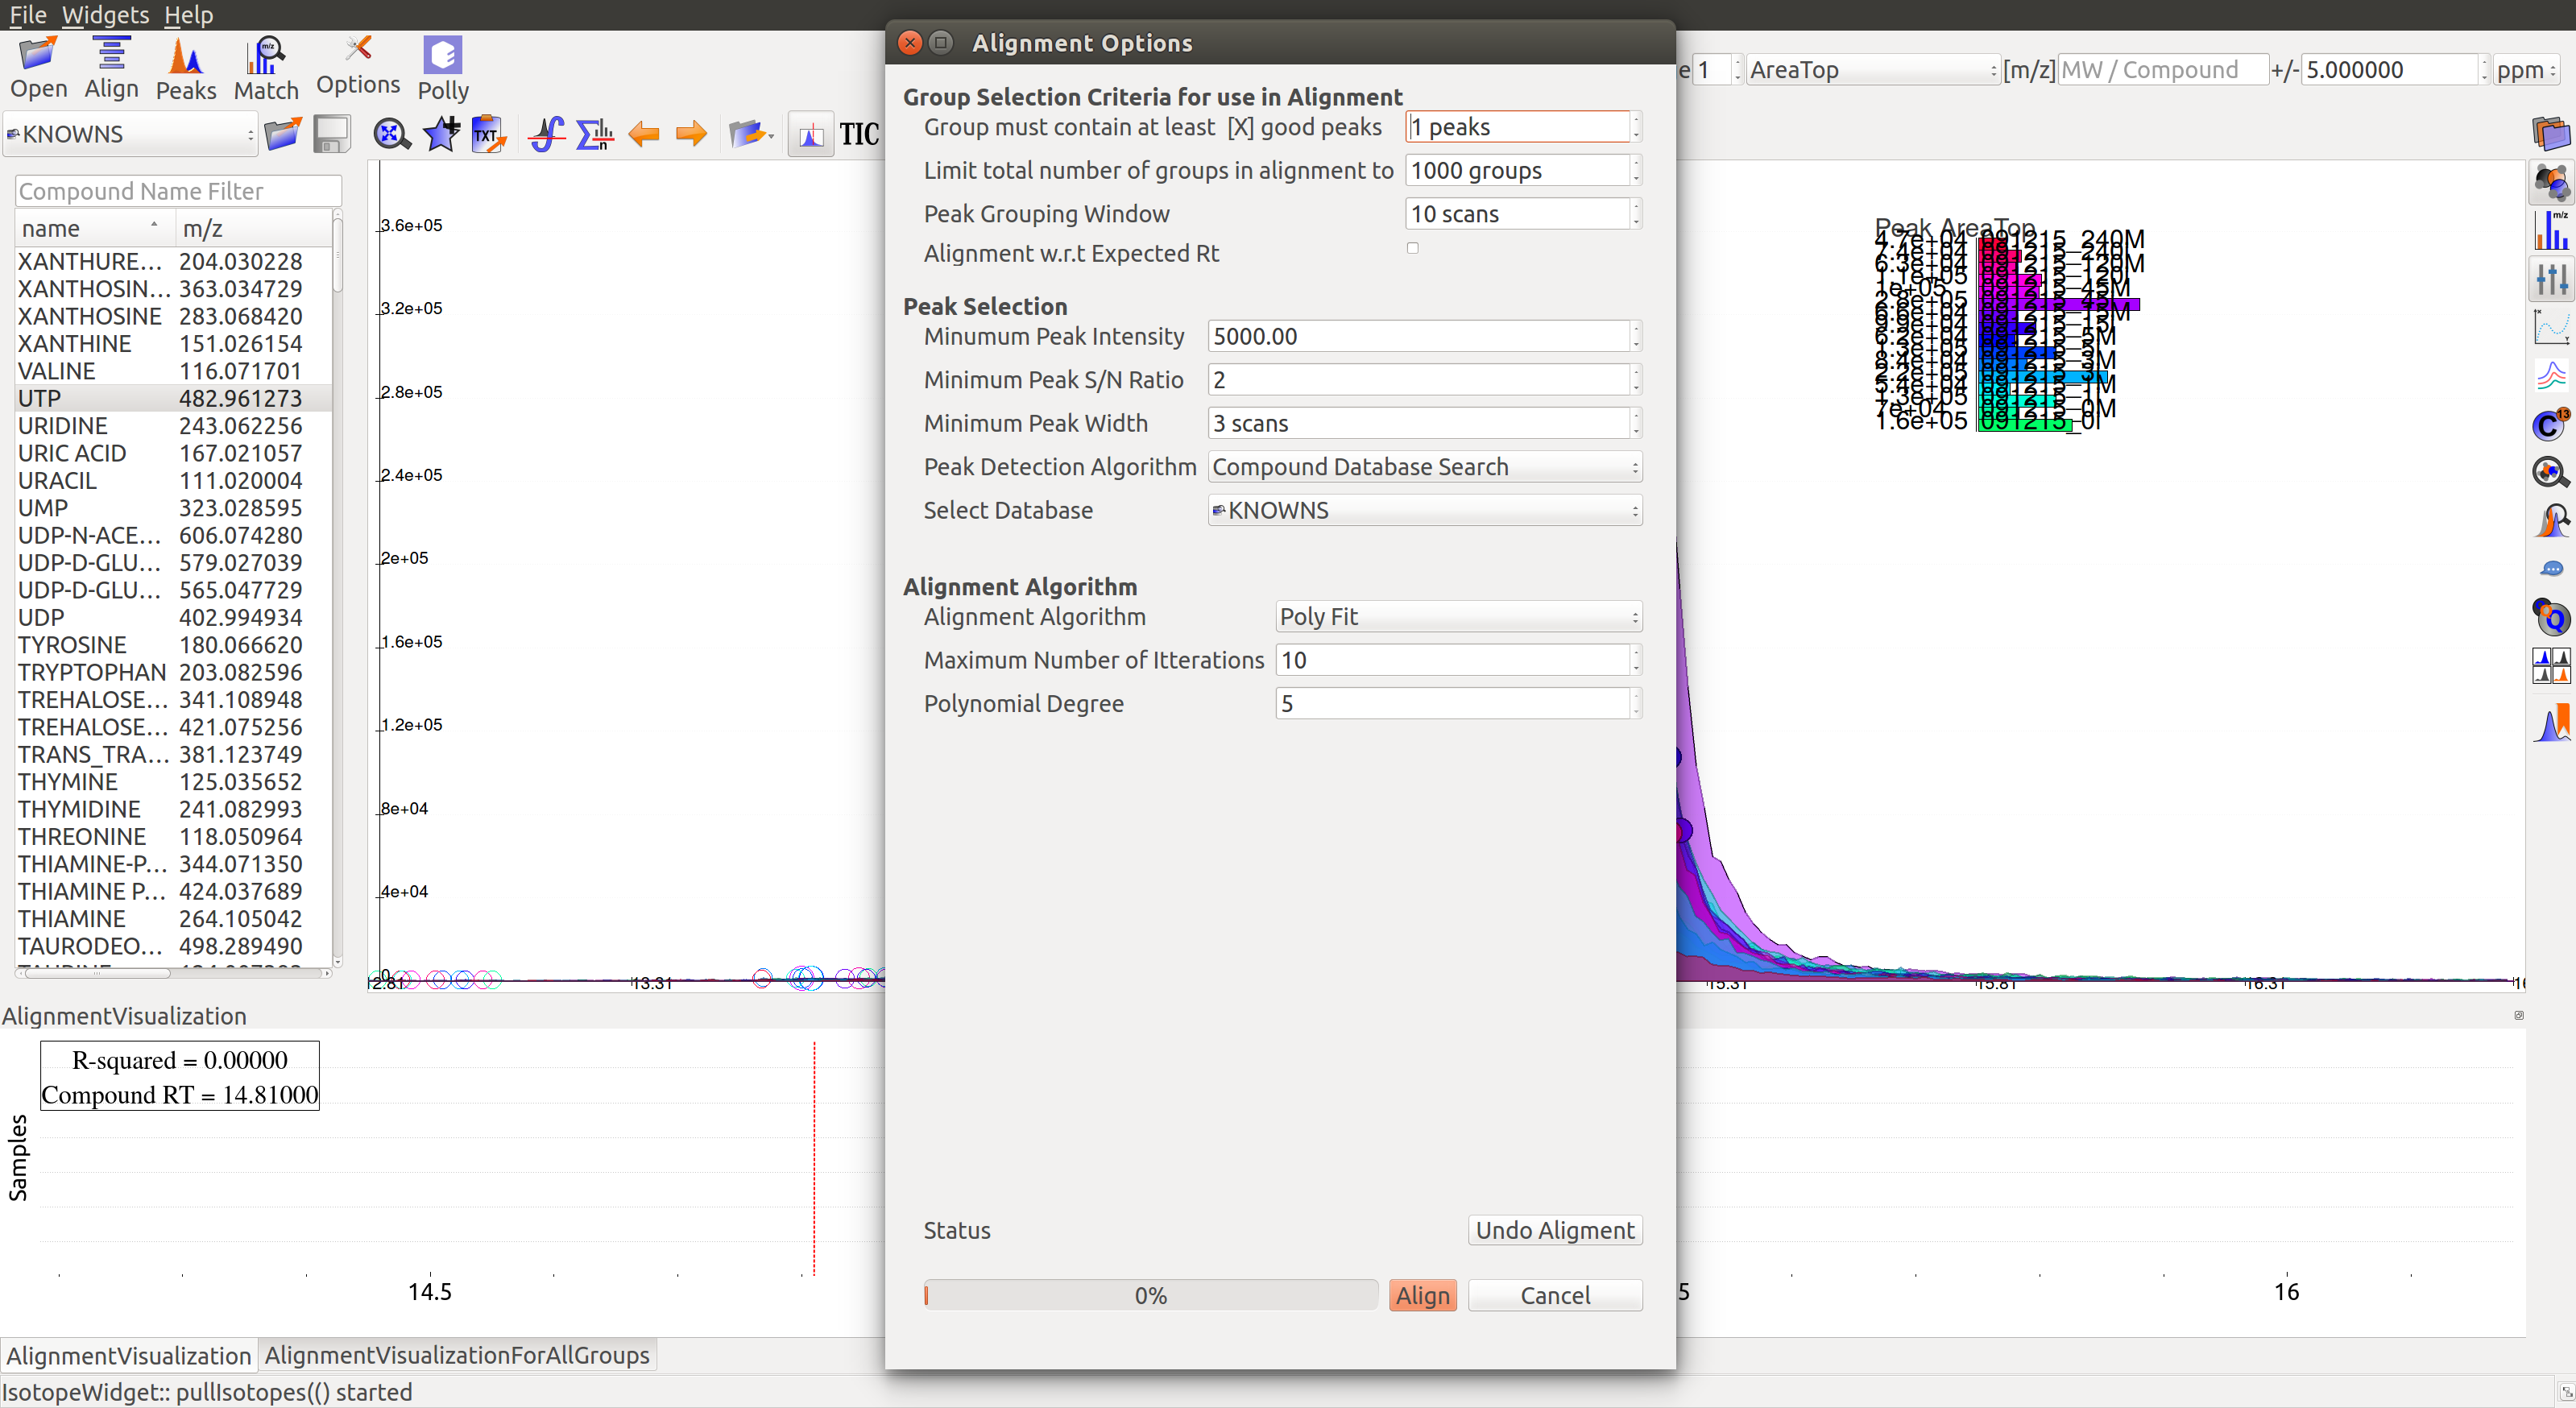
Perform Alignment
Alignment settings can be adjusted using the Align button  . This example was aligned with Poly fit algorithm with default parameters.
Post-alignment the peaks in the group should appear closer to the median retention time of the group.
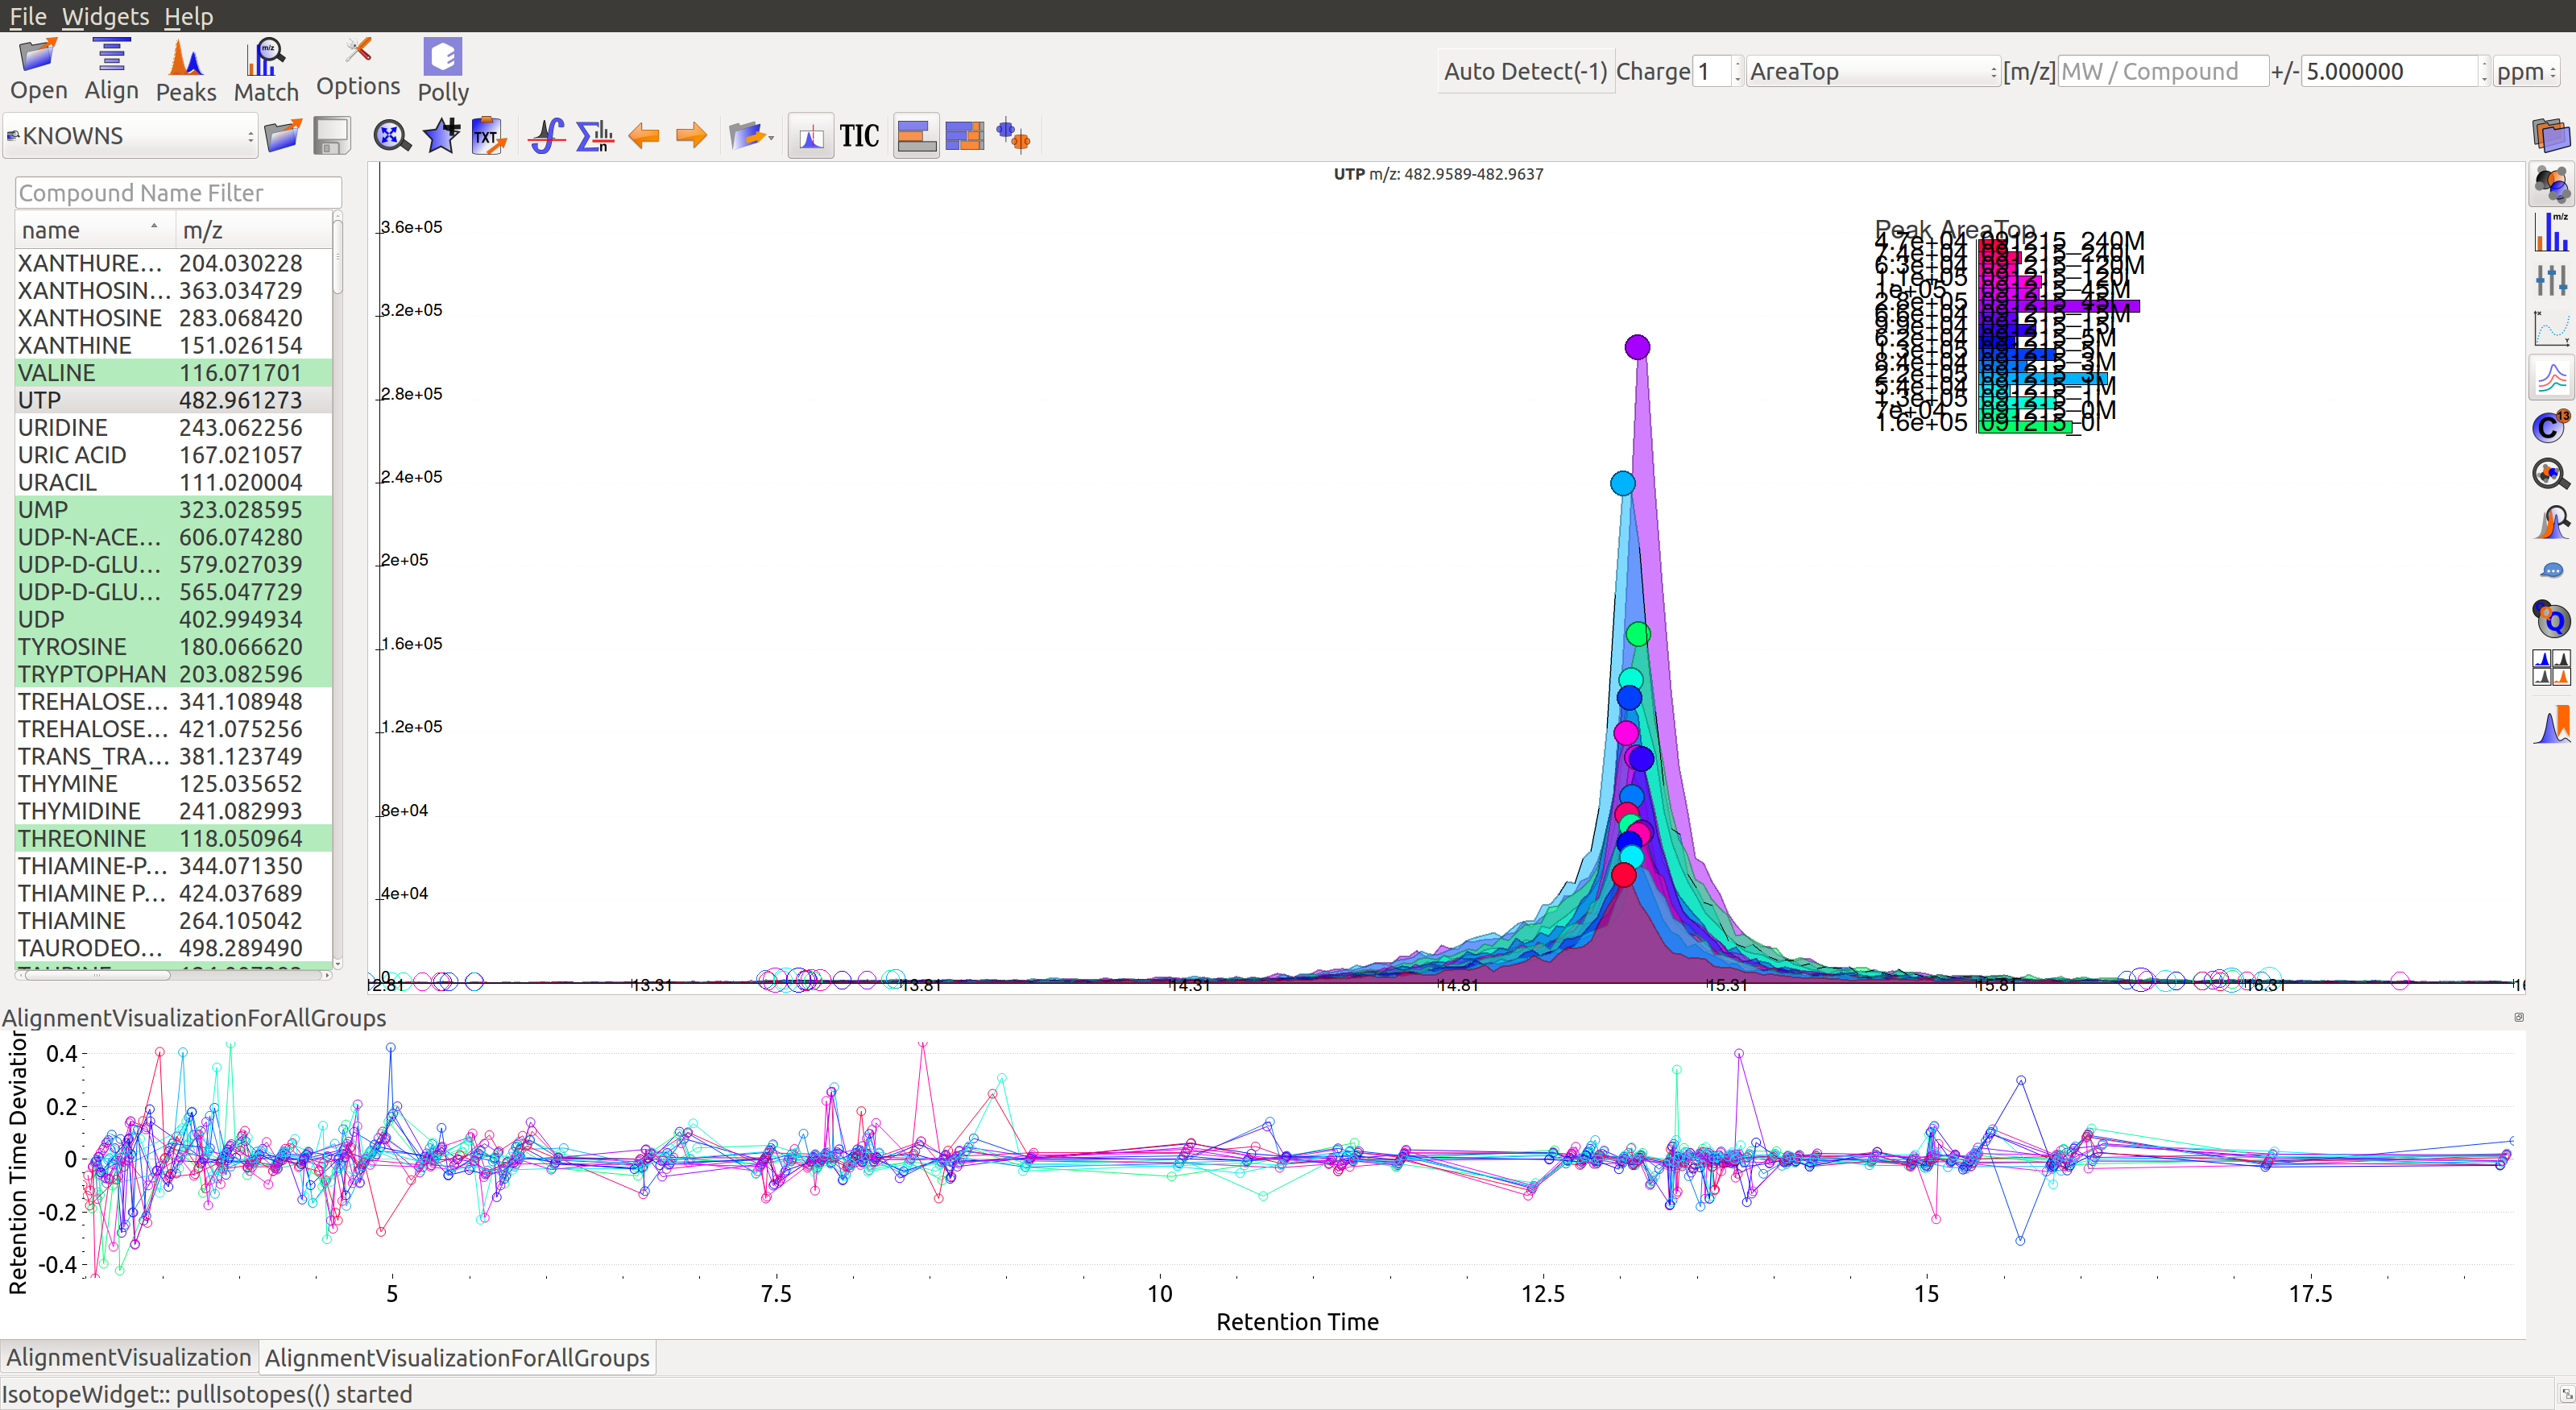
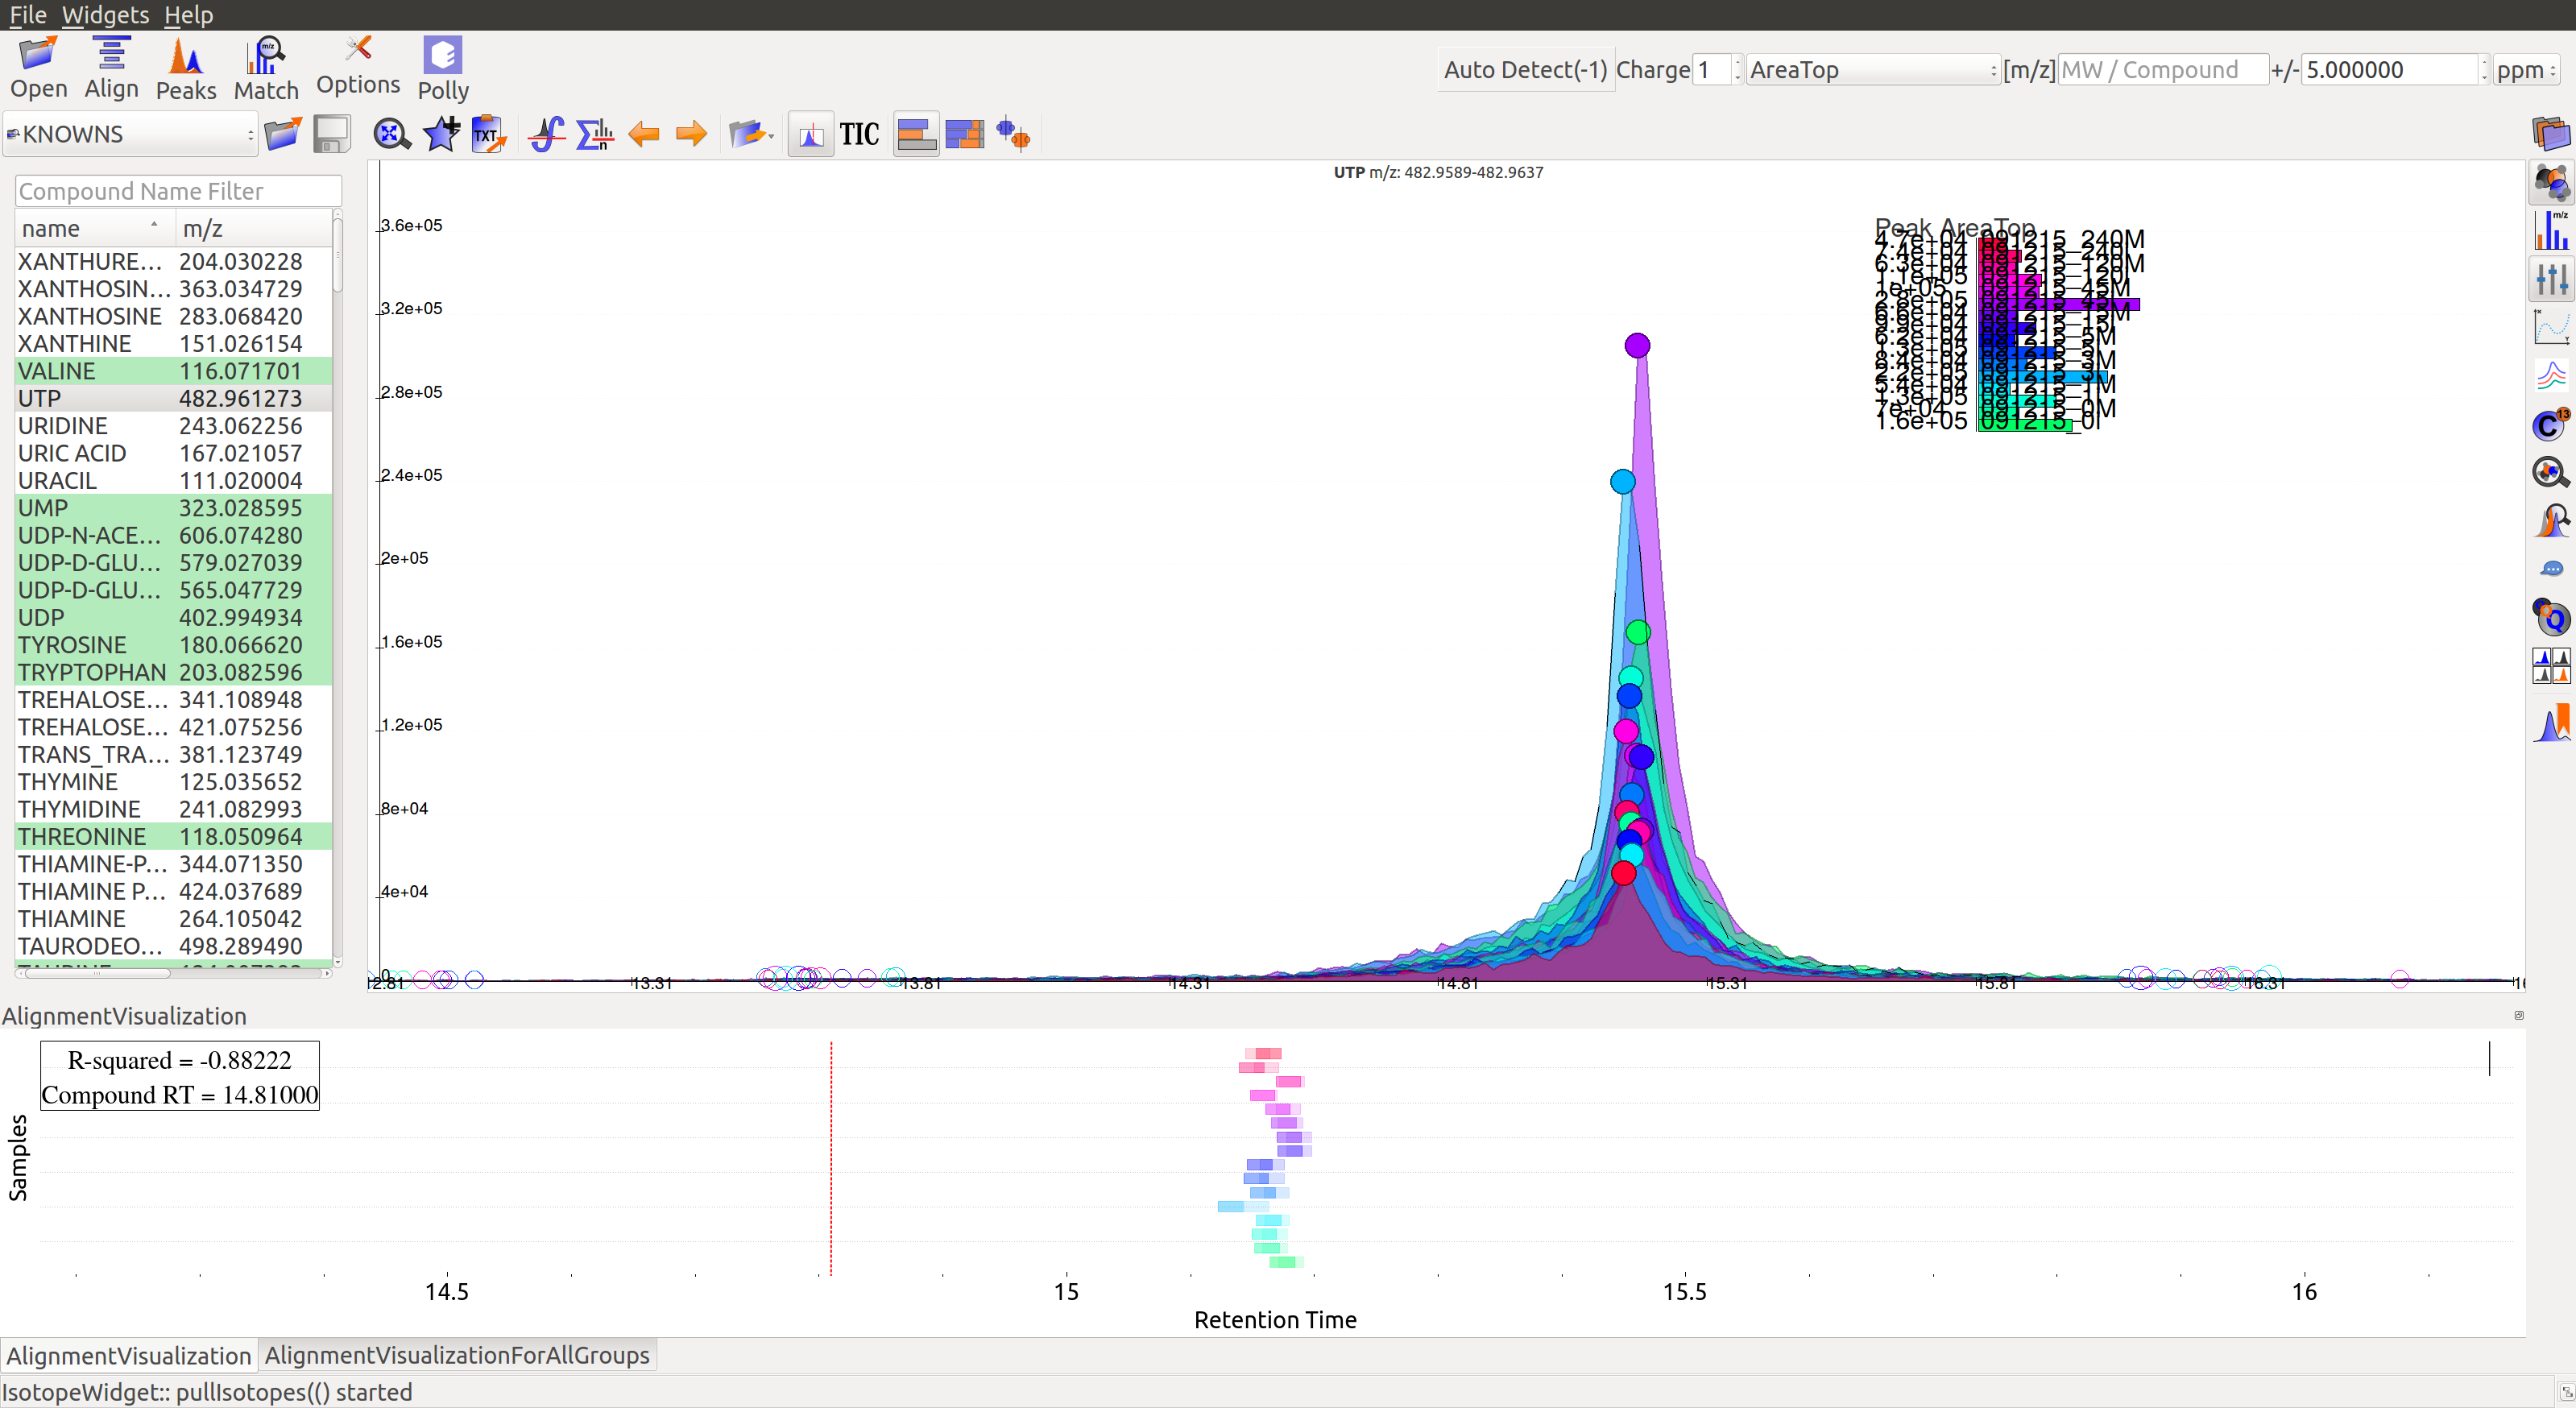
Pre-alignment, the peaks were considerably scattered while the aligned peaks lie nearly on the same axis. Users can run alignment again with different parameters if required (or with a different algorithm). Further details on Alignment settings are available on the Widgets page.
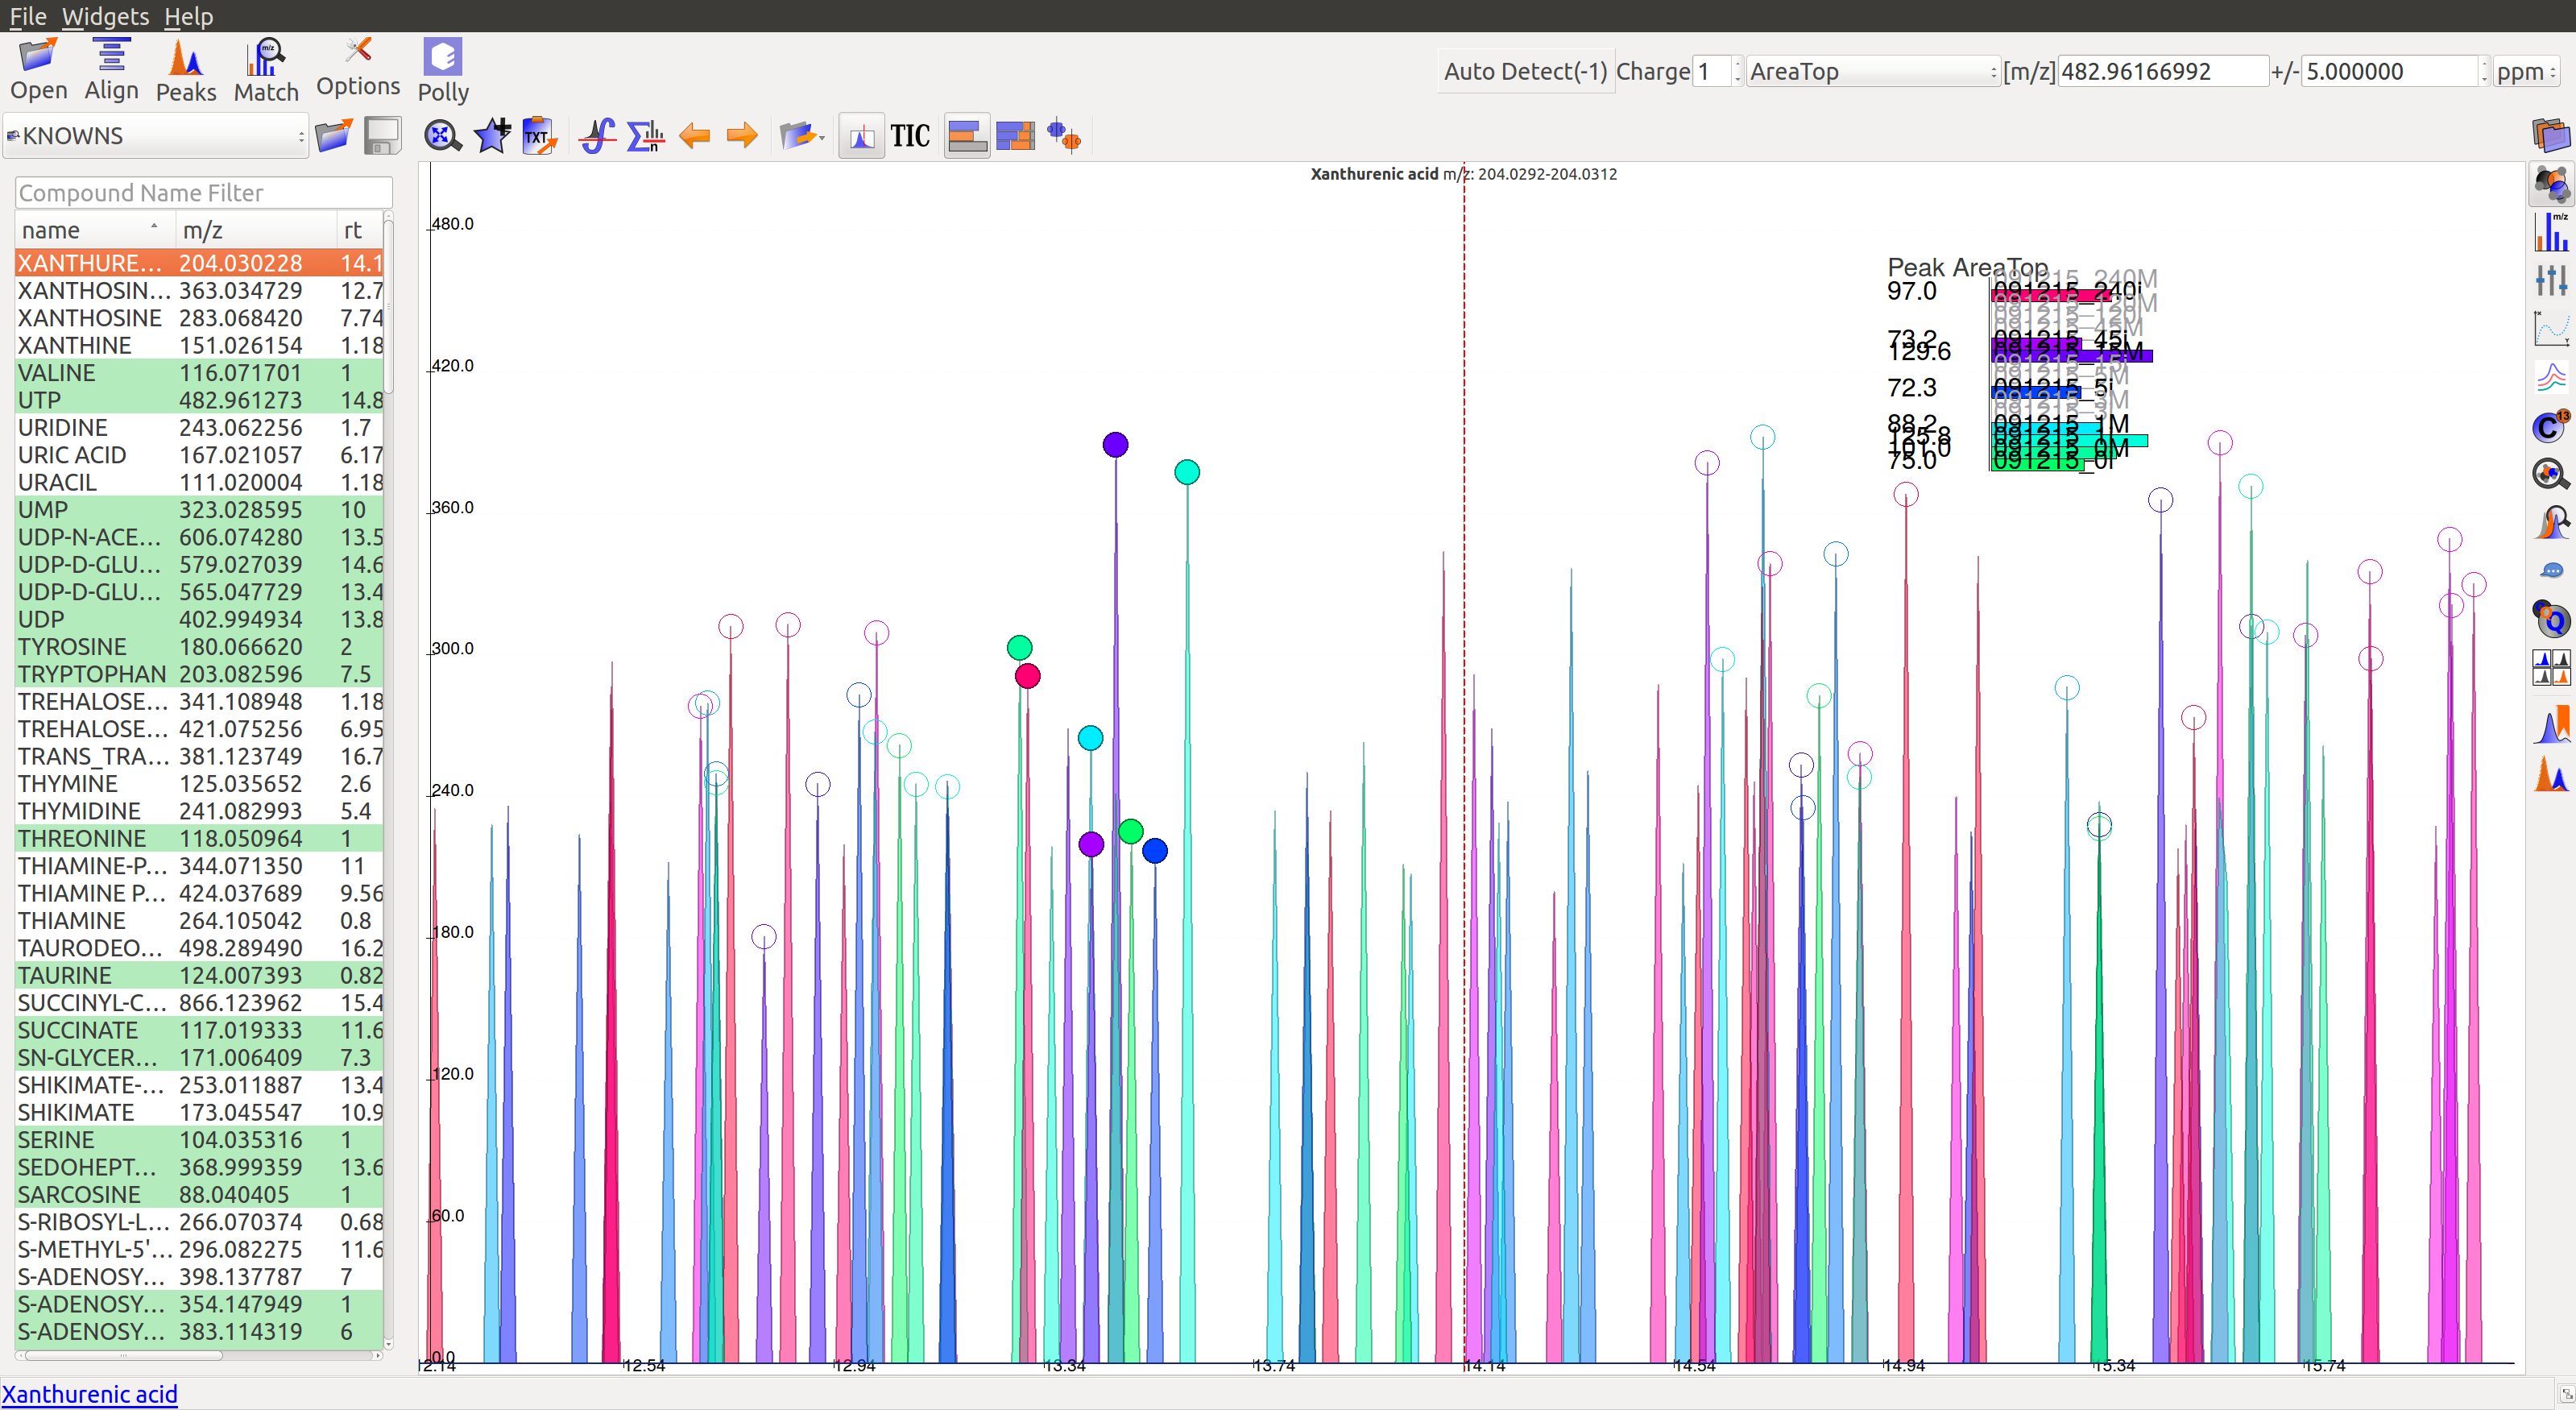
Peak Grouping
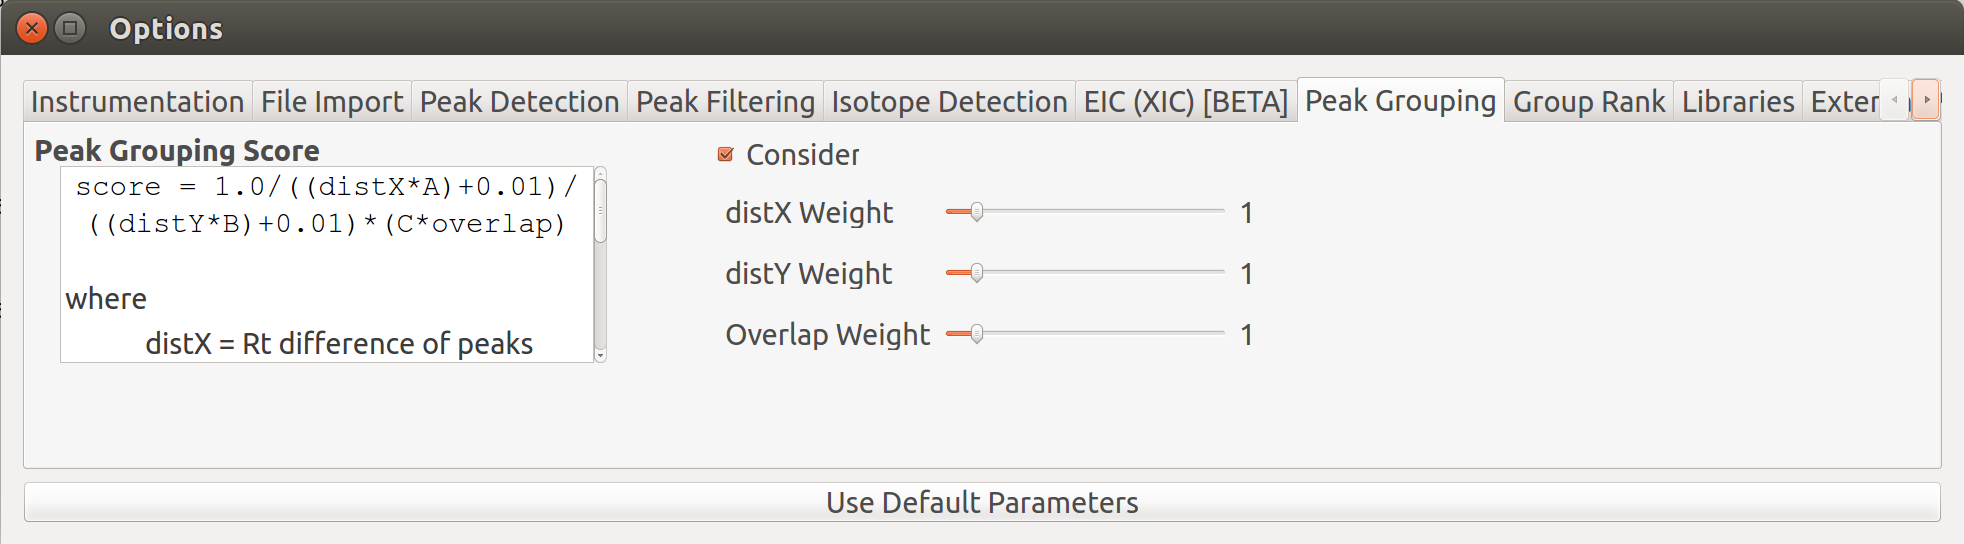
Peak grouping is an integral part of the El-MAVEN workflow that categorizes all detected peaks into groups on the basis of certain user-controlled parameters. A group score is calculated for every peak during the process. The formula for this score takes into account the difference in retention time, intensities between peaks (smaller difference leads to a better score) and any existing overlap between them (higher extent of overlap leads to better score). All three parameters have certain weights attached to them that can be controlled by the users. The formula for the score is shown in the image. More details on it can be found on the Widgets page.
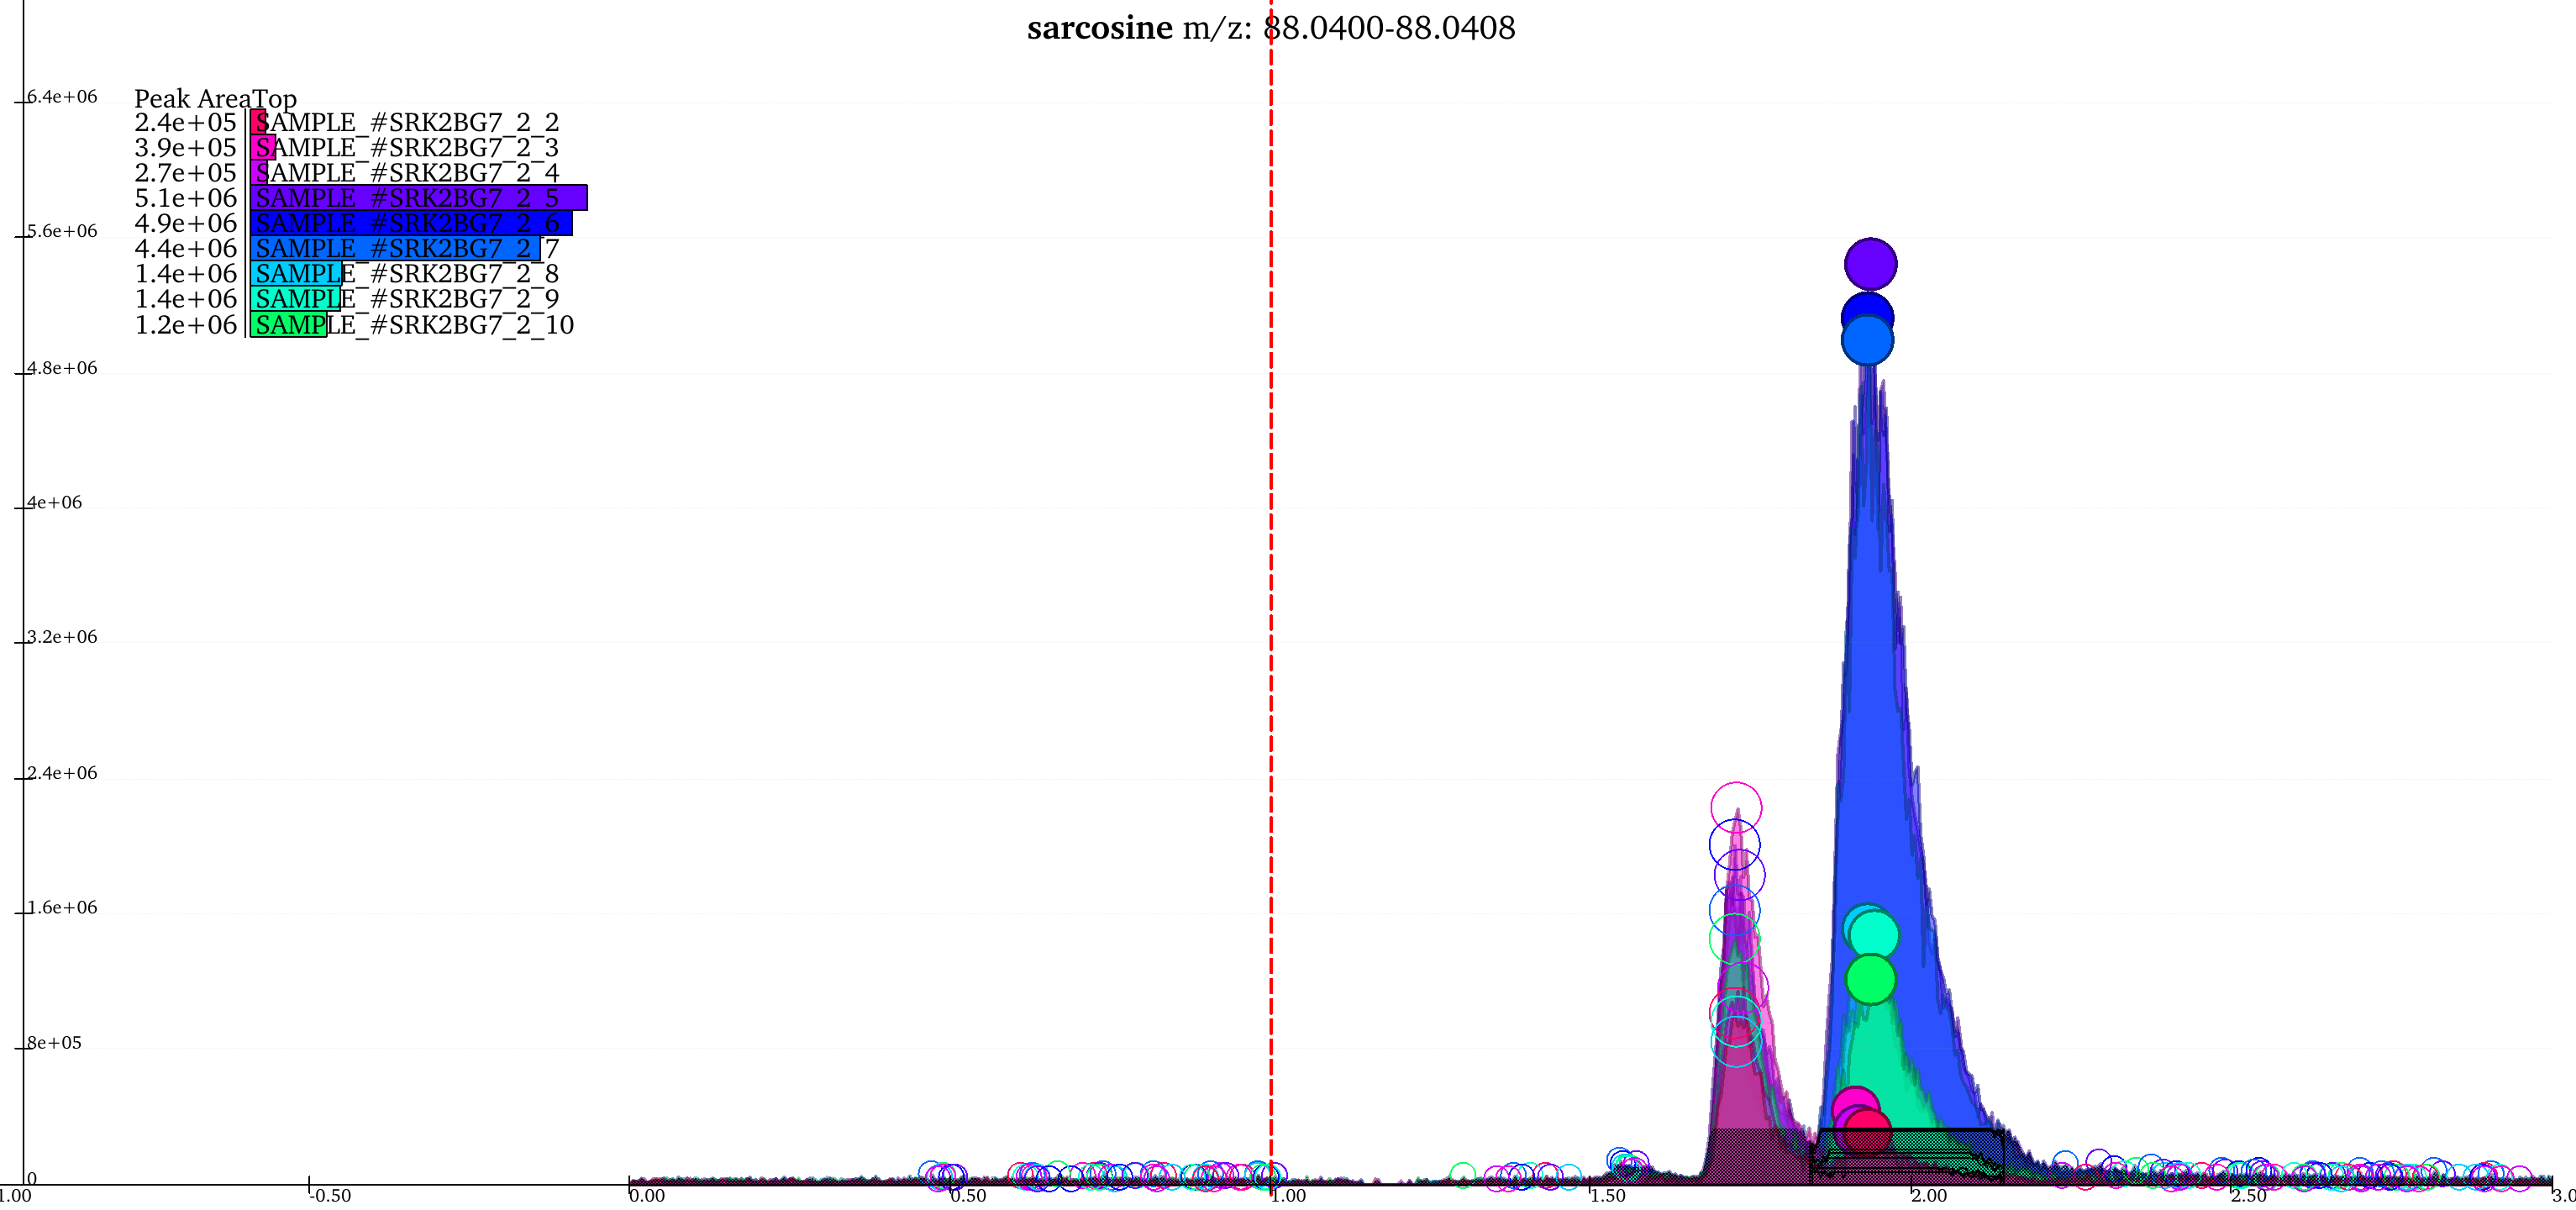
The above image shows two groups in the EIC window. The highlighted (solid circles) peaks belong to group A, the peaks to its left with empty circles belong to another group B. The short peaks in group A that are close to the baseline and peaks in group B come from the same samples. Additionally, the high intensity peaks of group A have a similar peak shape to group B peaks. These peaks might have been wrongly classified into separate groups because of the difference in retention time range of the two sets of peaks. The weights attached to difference in retention time and intensities, and extent of overlap can be adjusted for better grouping.
Grouping parameters can be changed from the Options dialog .
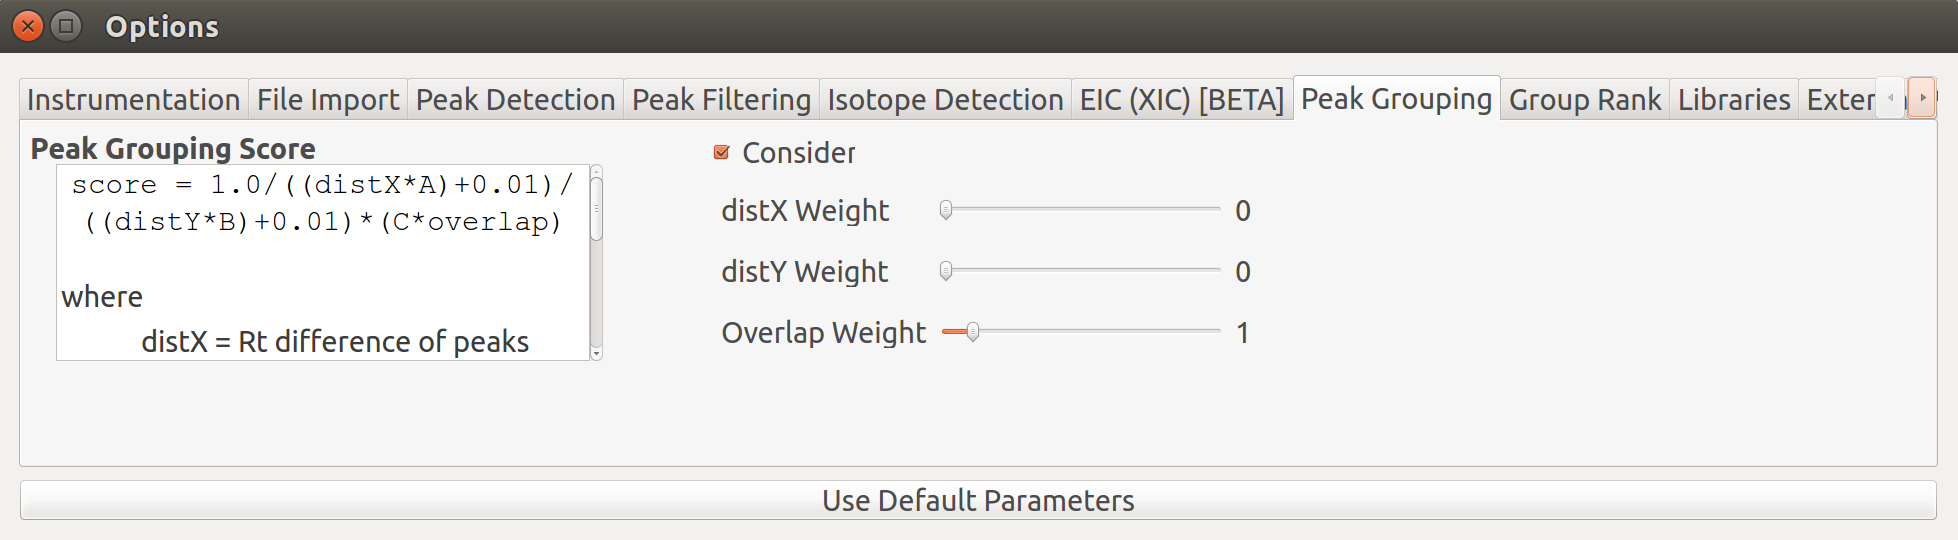
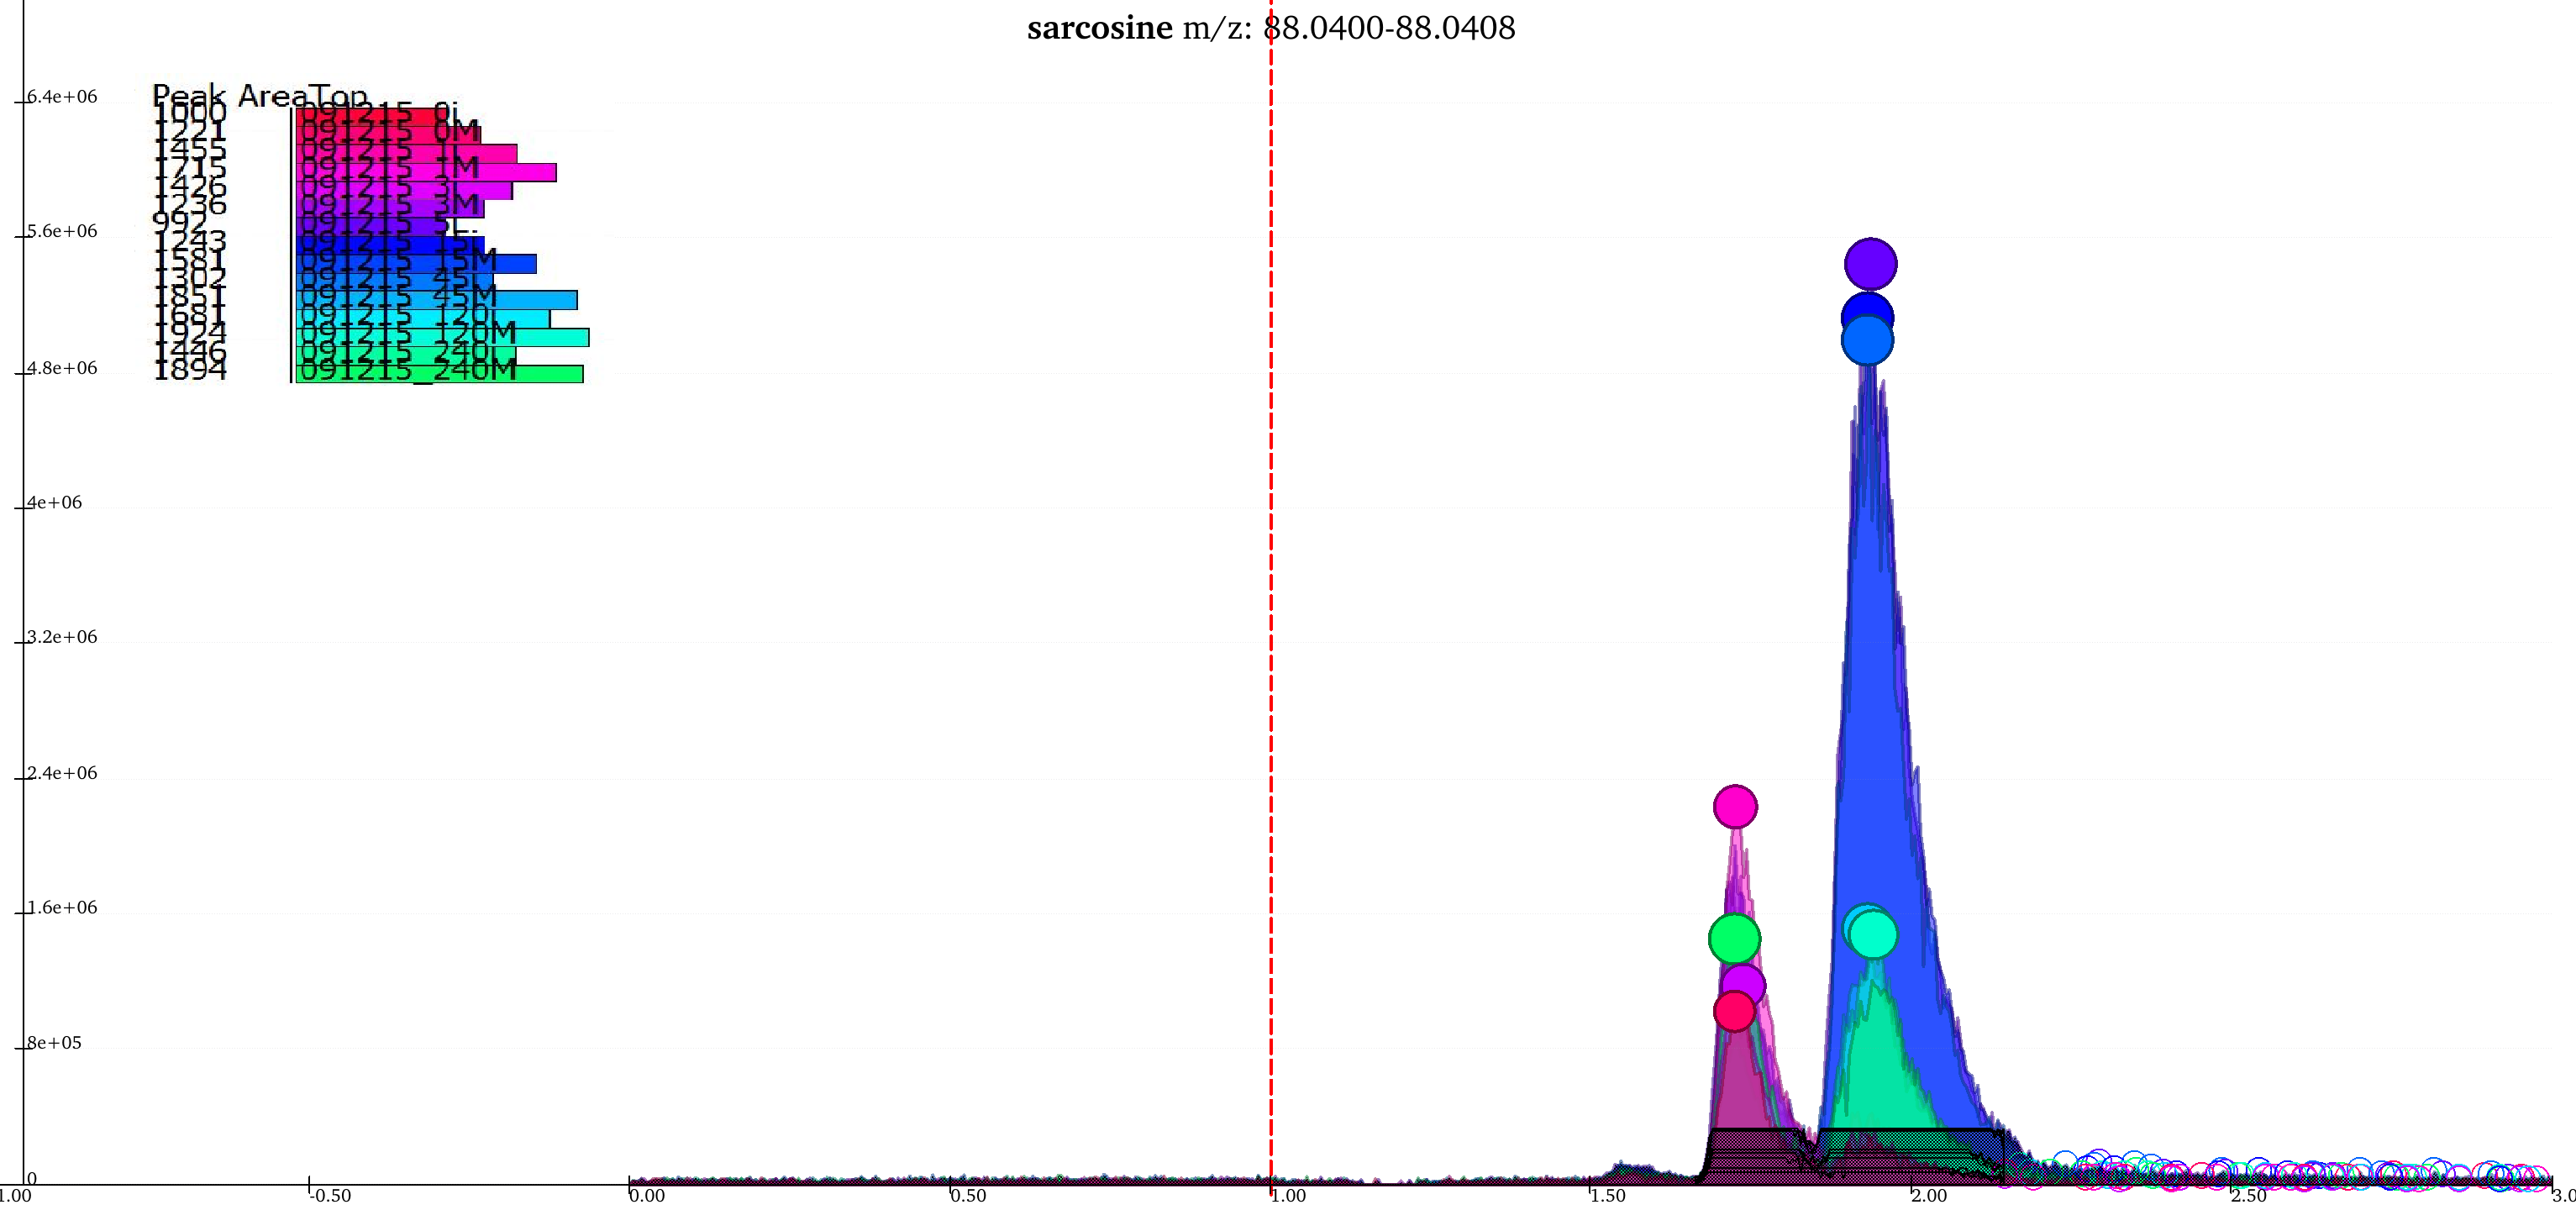
Giving less priority to difference in retention time and intensities results in the two groups being merged into a single group while the peaks that lay close to the baseline are no longer classified as valid peaks.
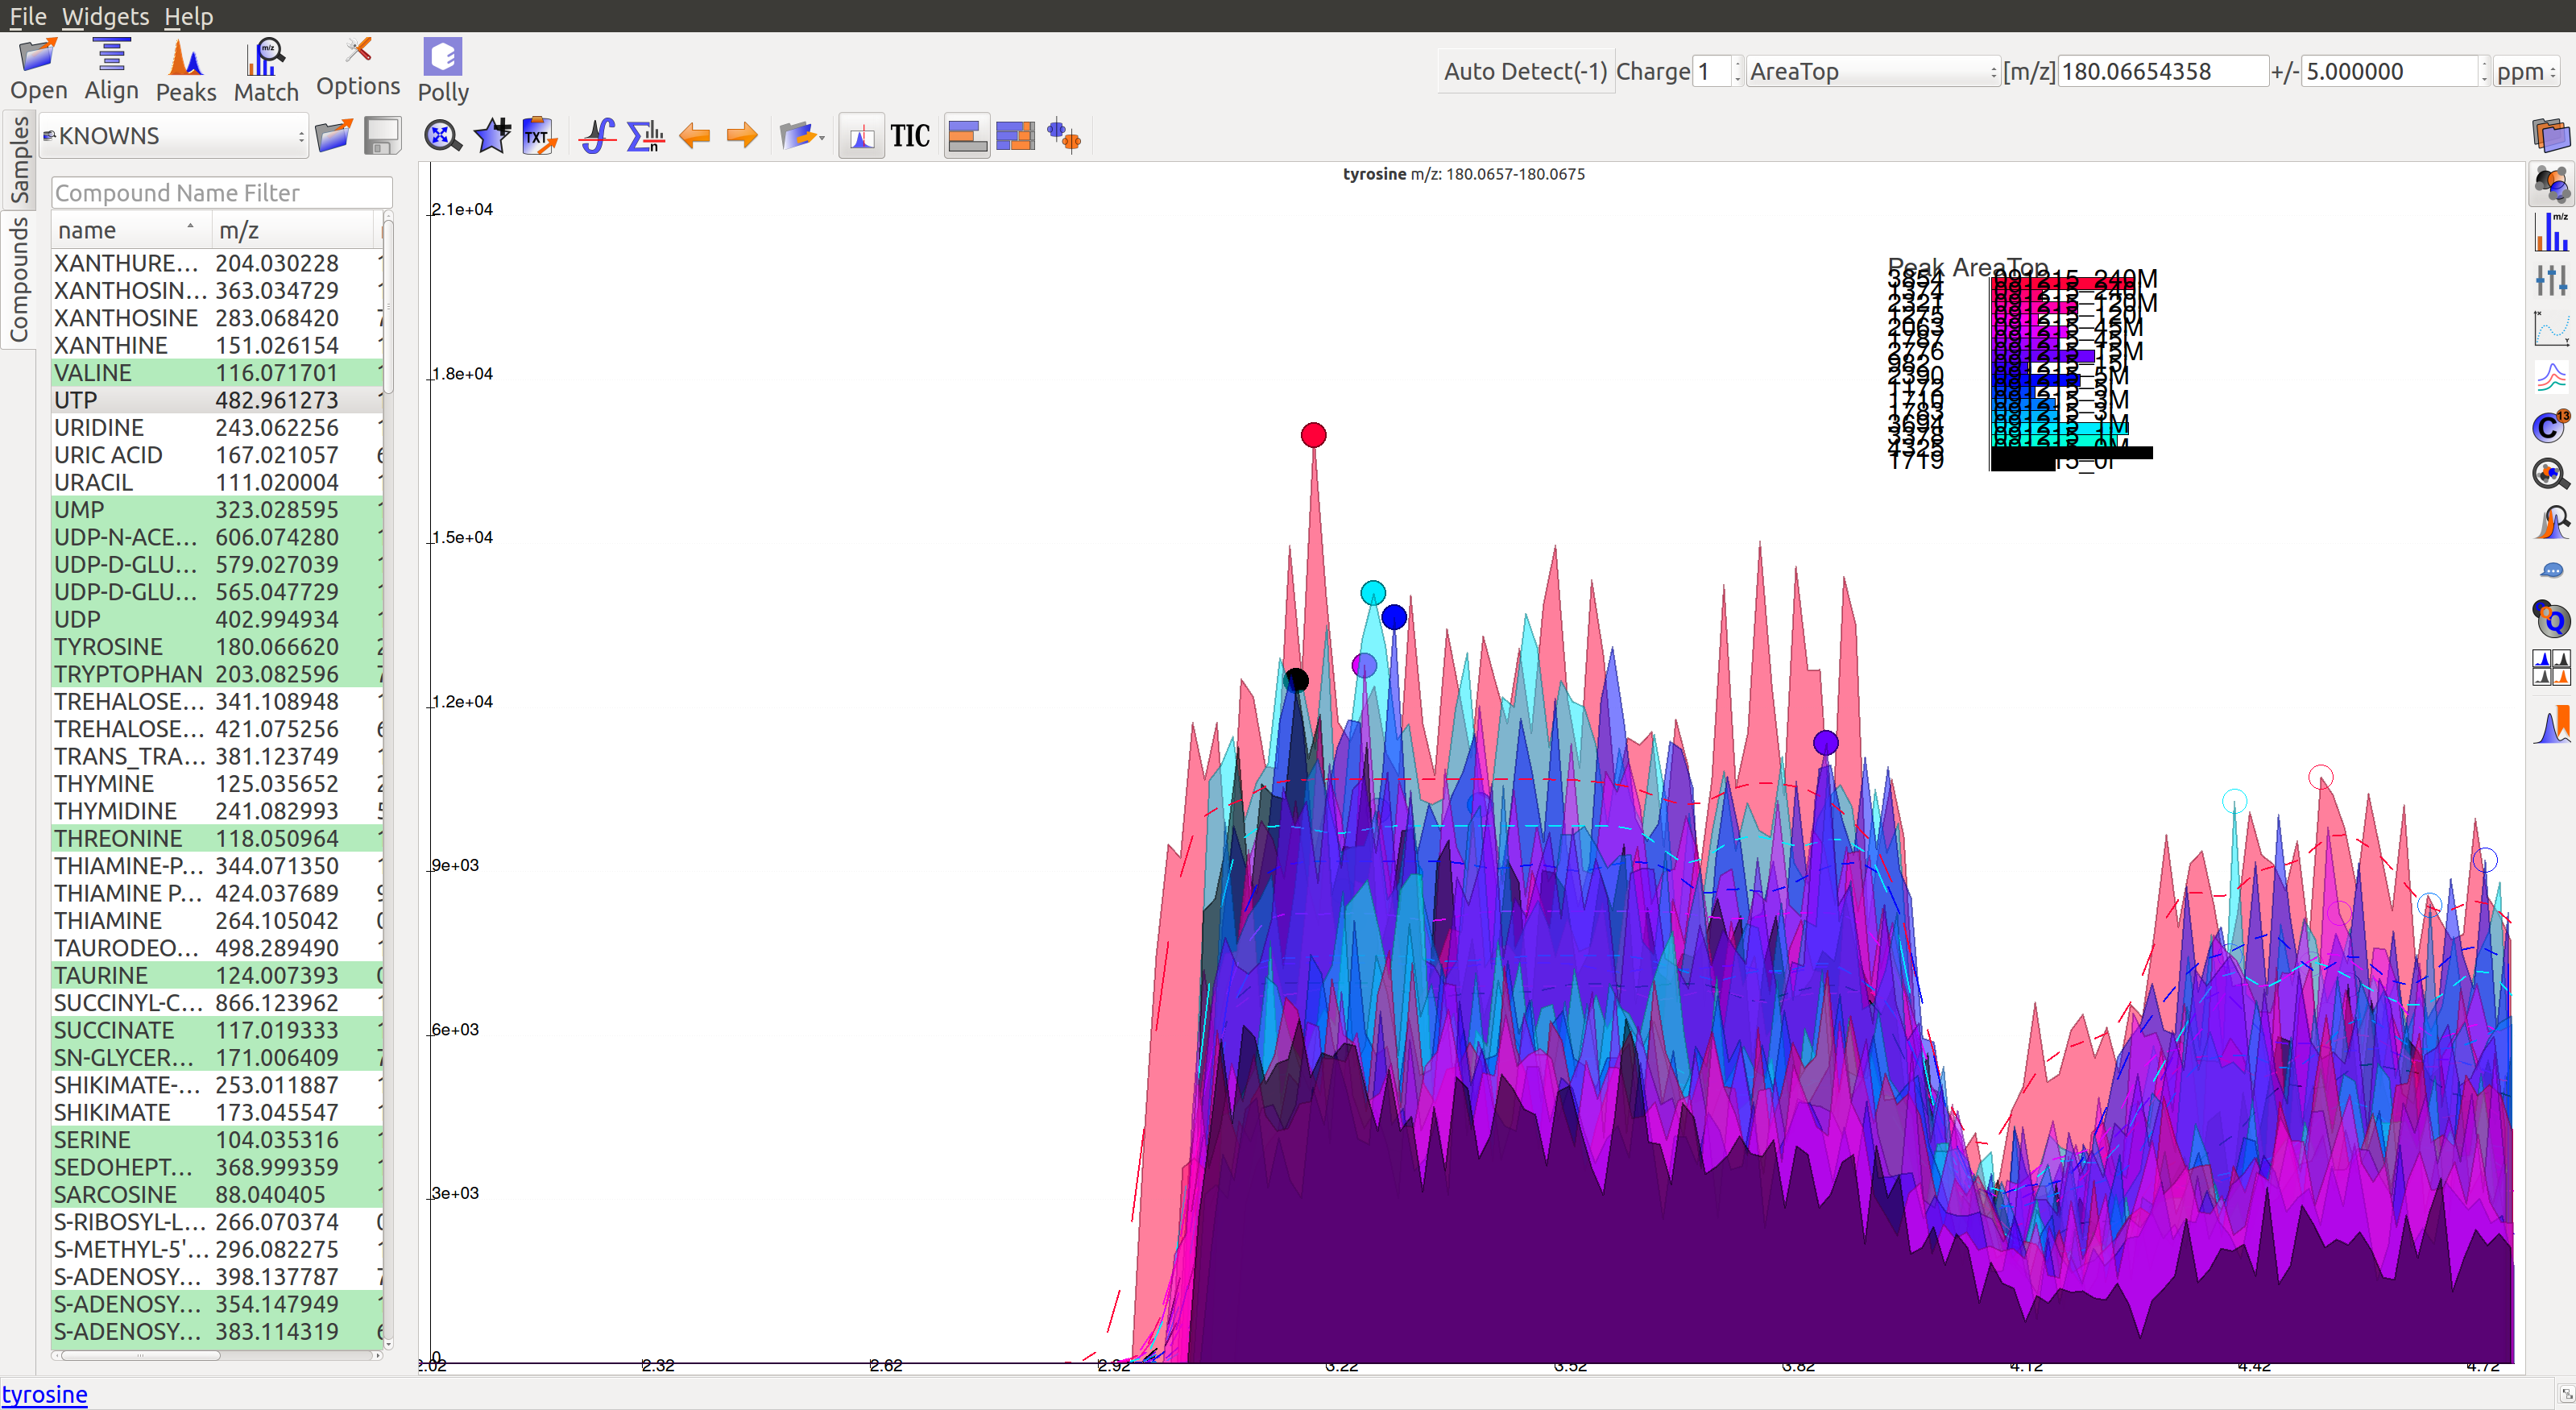
Baseline
When measuring a number of peaks, it is often more effective to subtract an estimated baseline from the data. This baseline should be set where ideally no peaks occur. Although sometimes the program sets a particular baseline such that one or more peaks occur below that baseline value. In the following image, the dashed line represents each baseline:
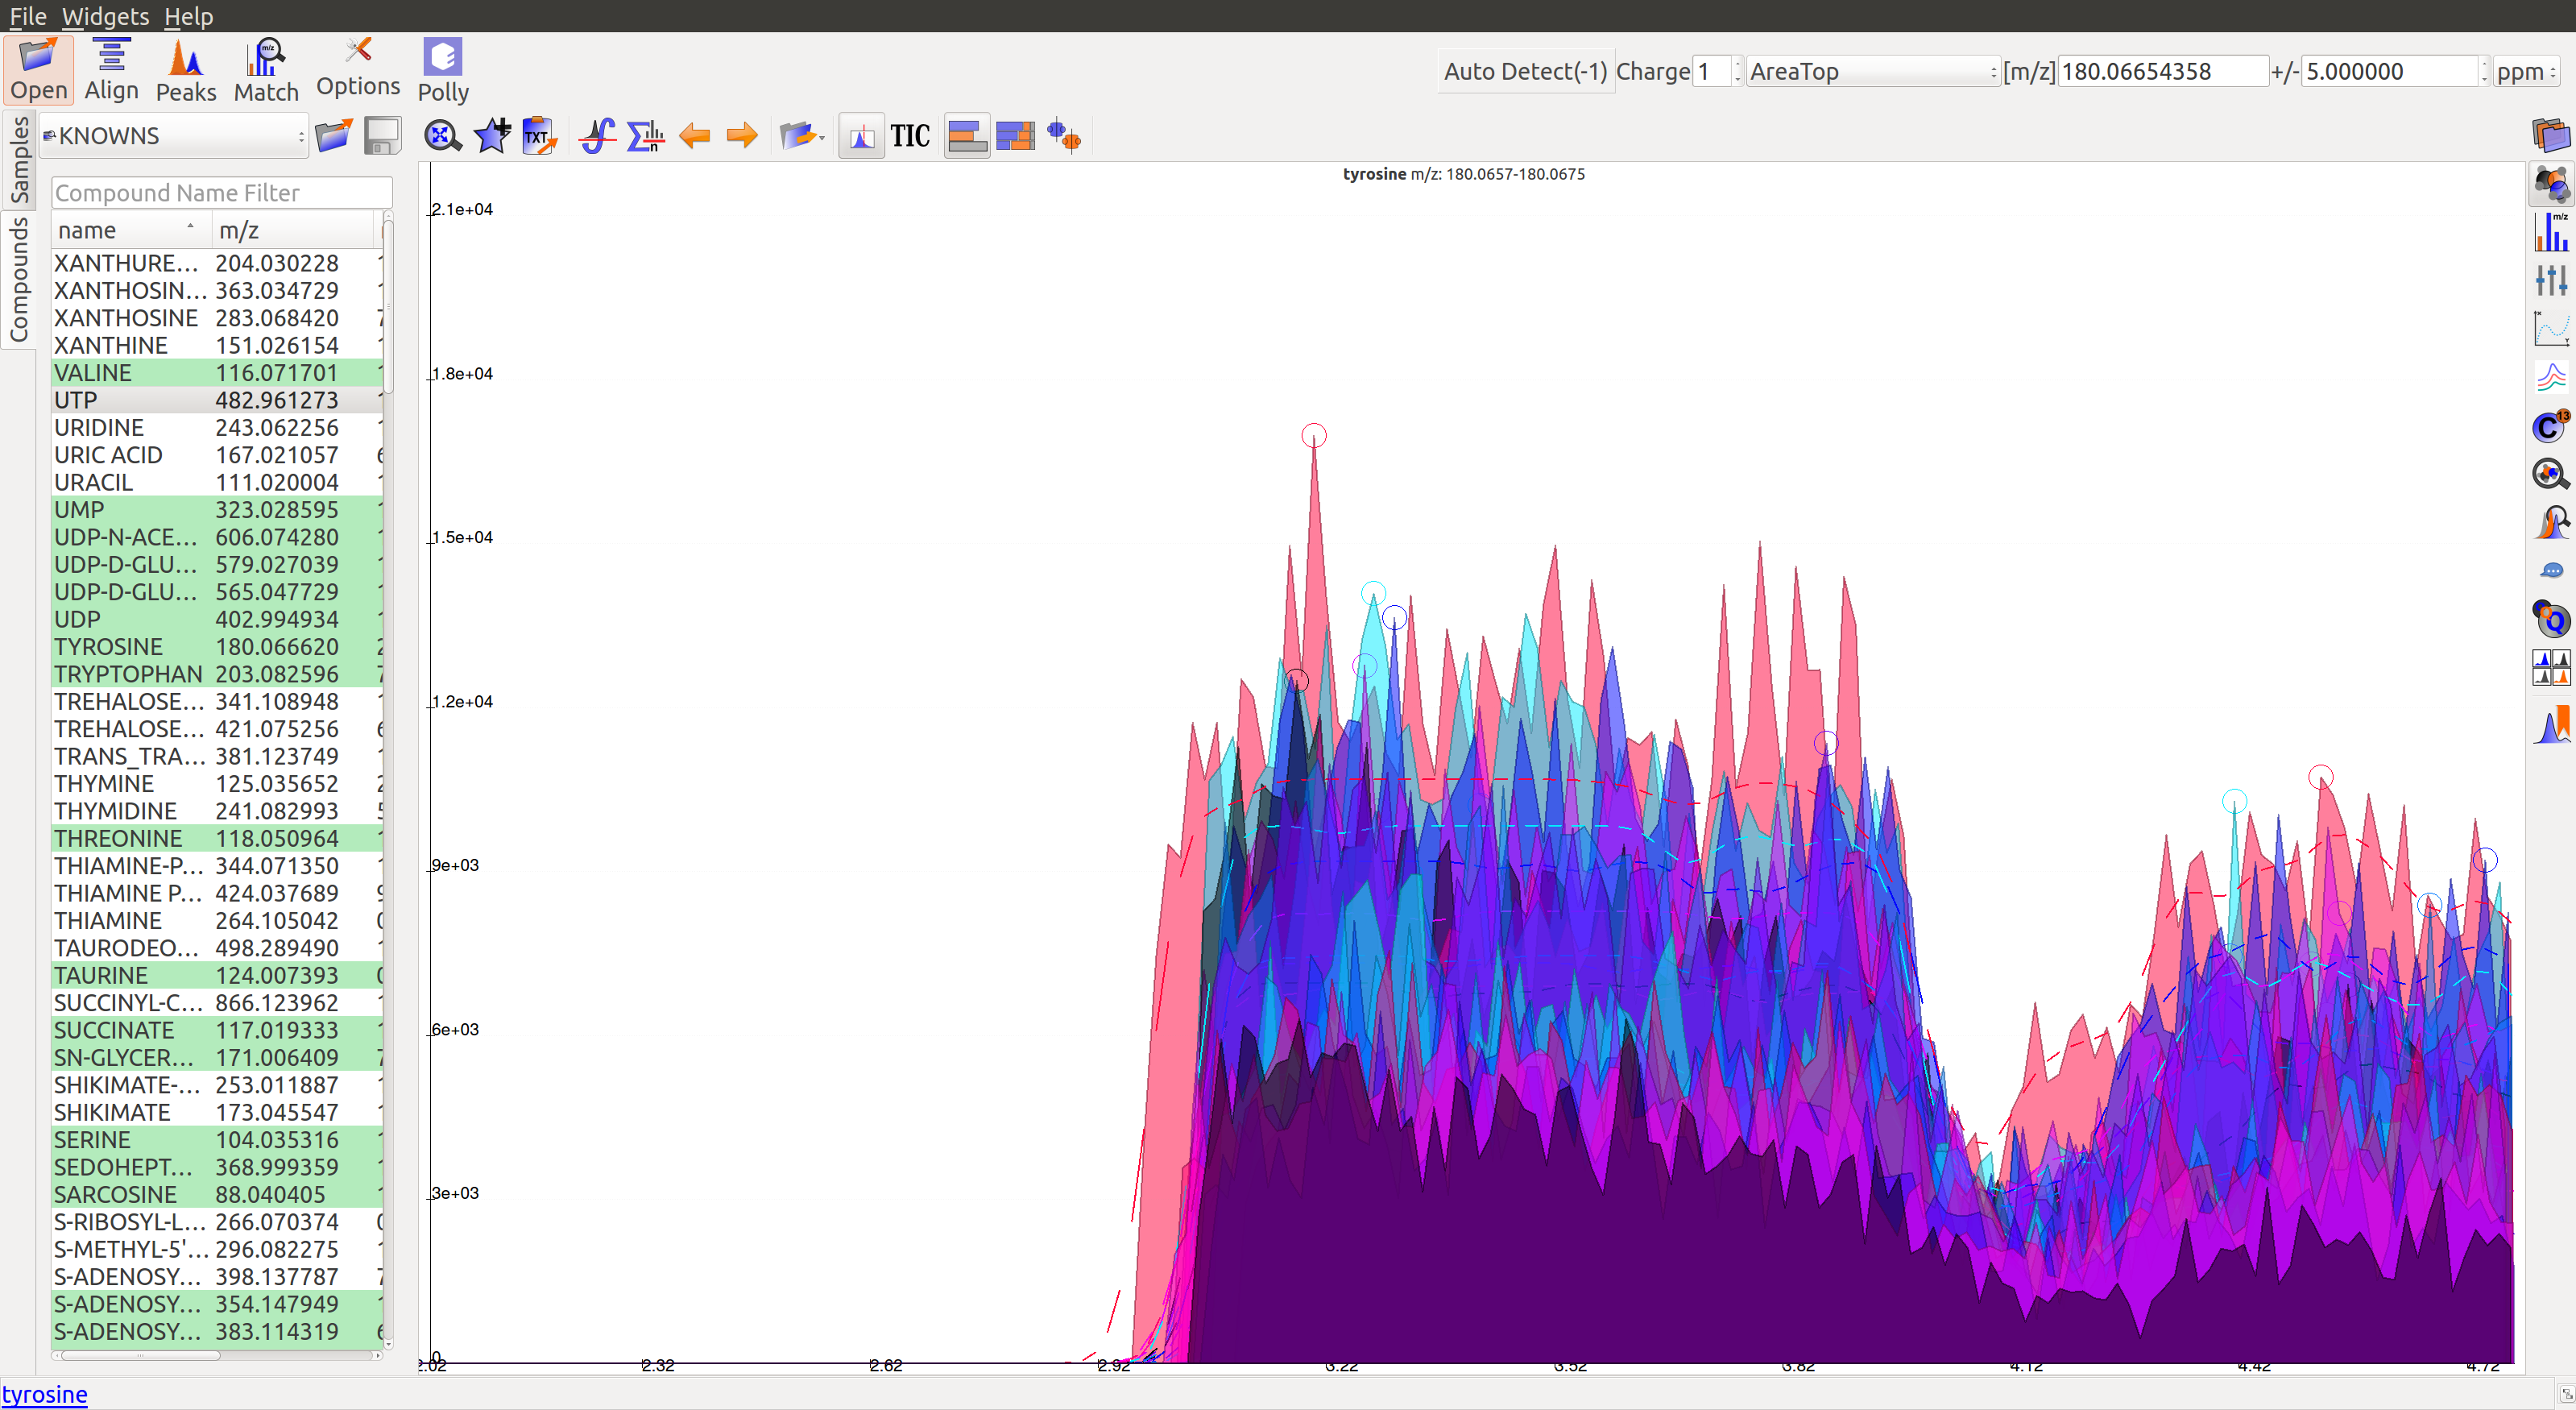
The corresponding peaks are indicated with solid circles:
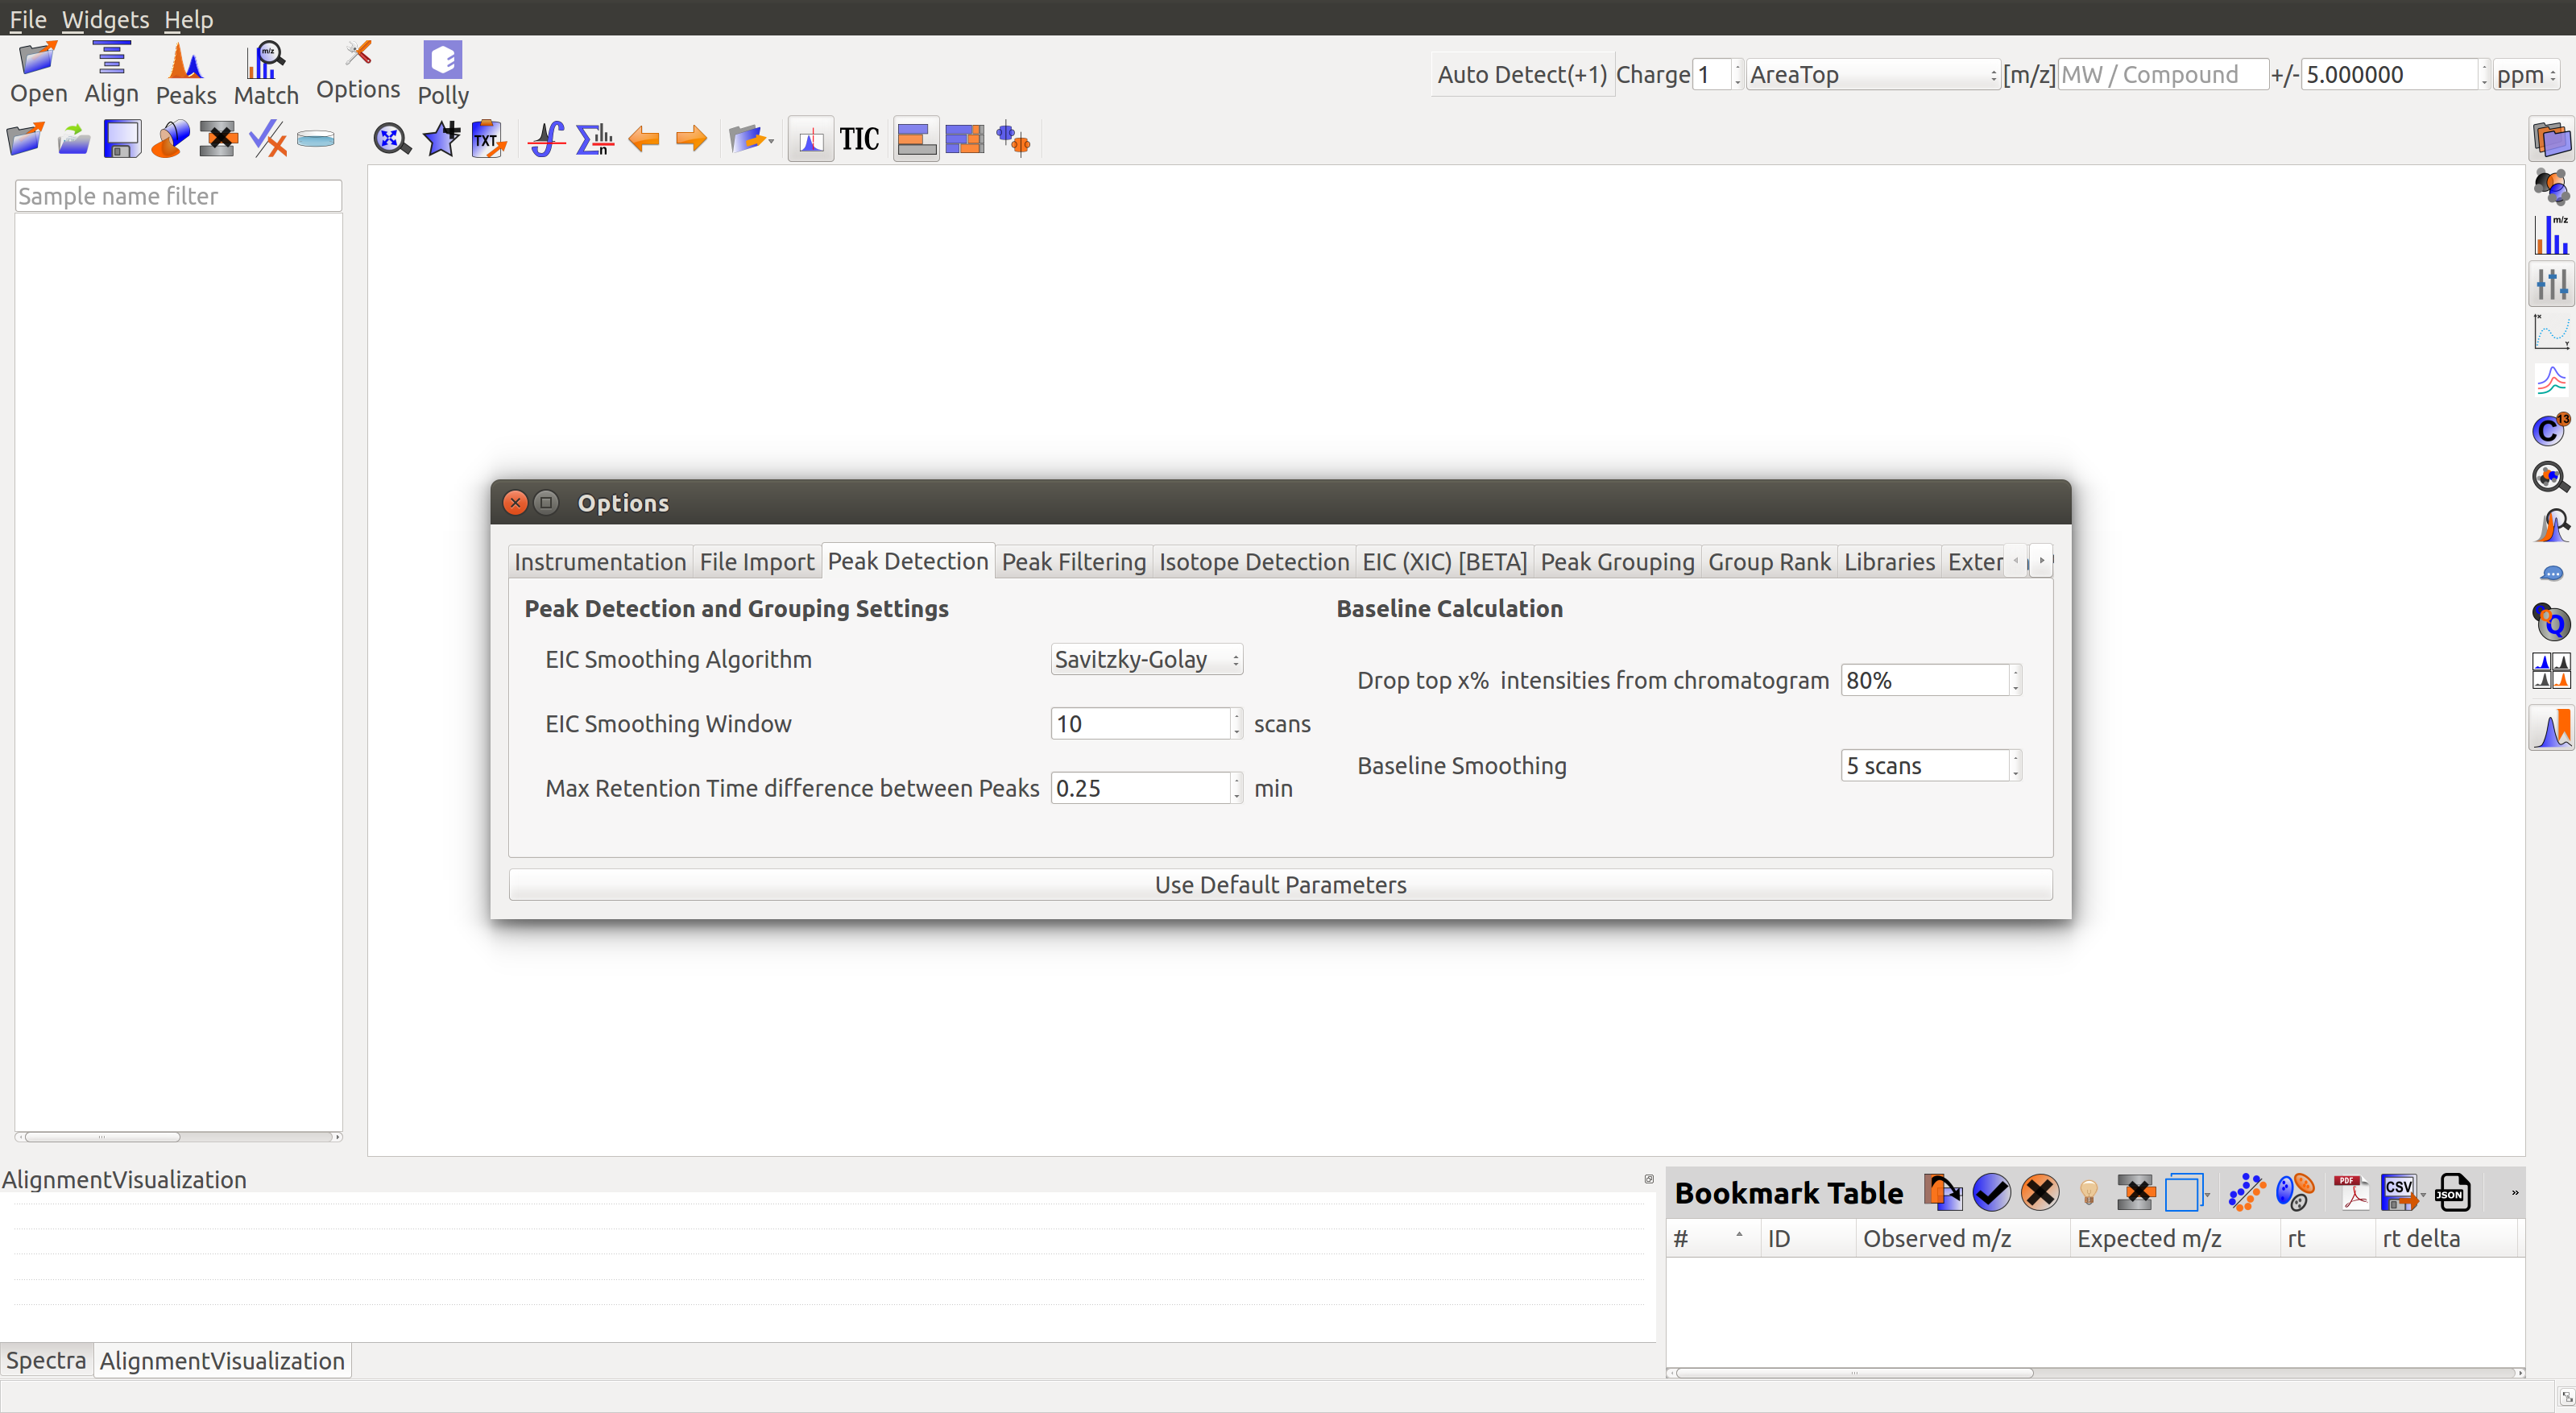
The baseline correction can be done in the Peak Detection tab by clicking on Options button:
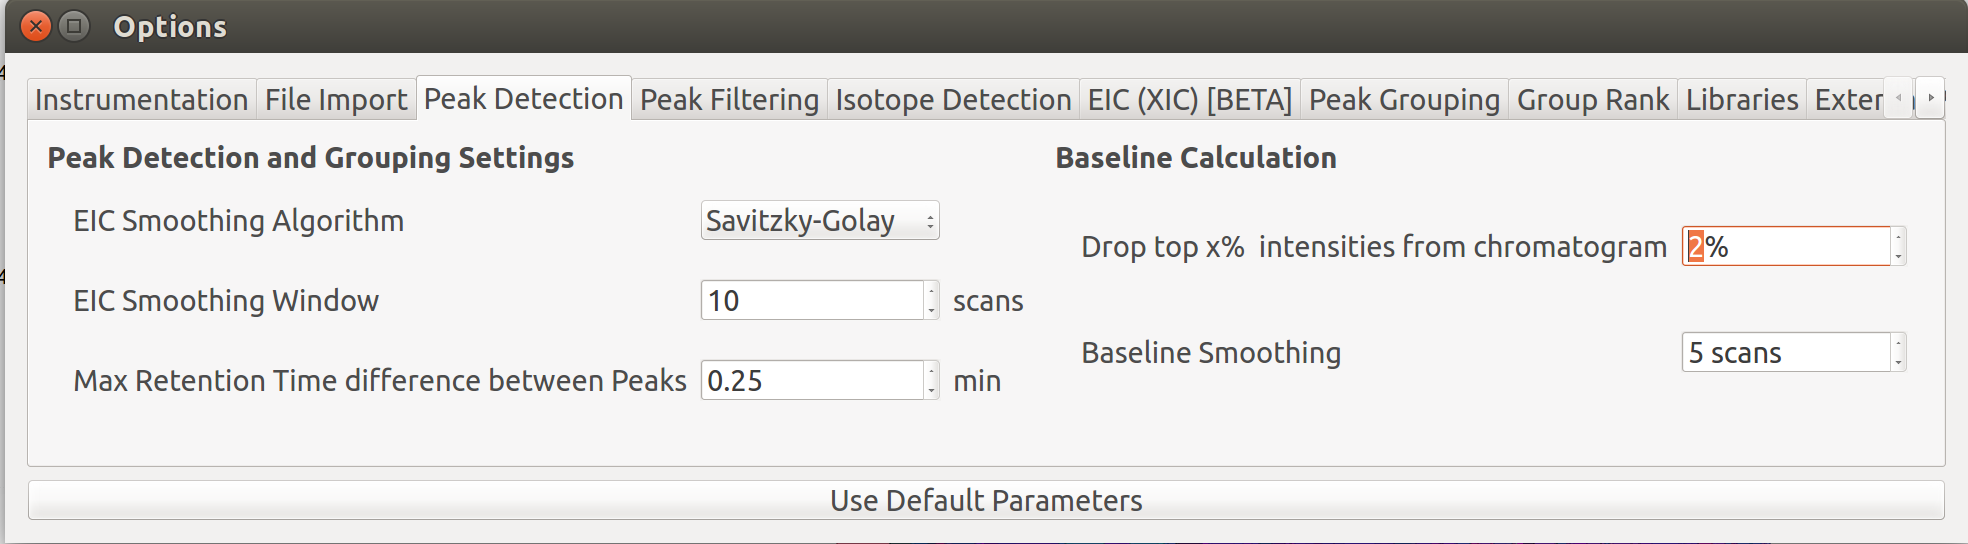
Further details on settings can be accessed here.
Isotope Detection
Samples are labeled?
The Peaks dialog  can be used to detect labeled peaks along with the unlabeled ones in the Peaks Table.
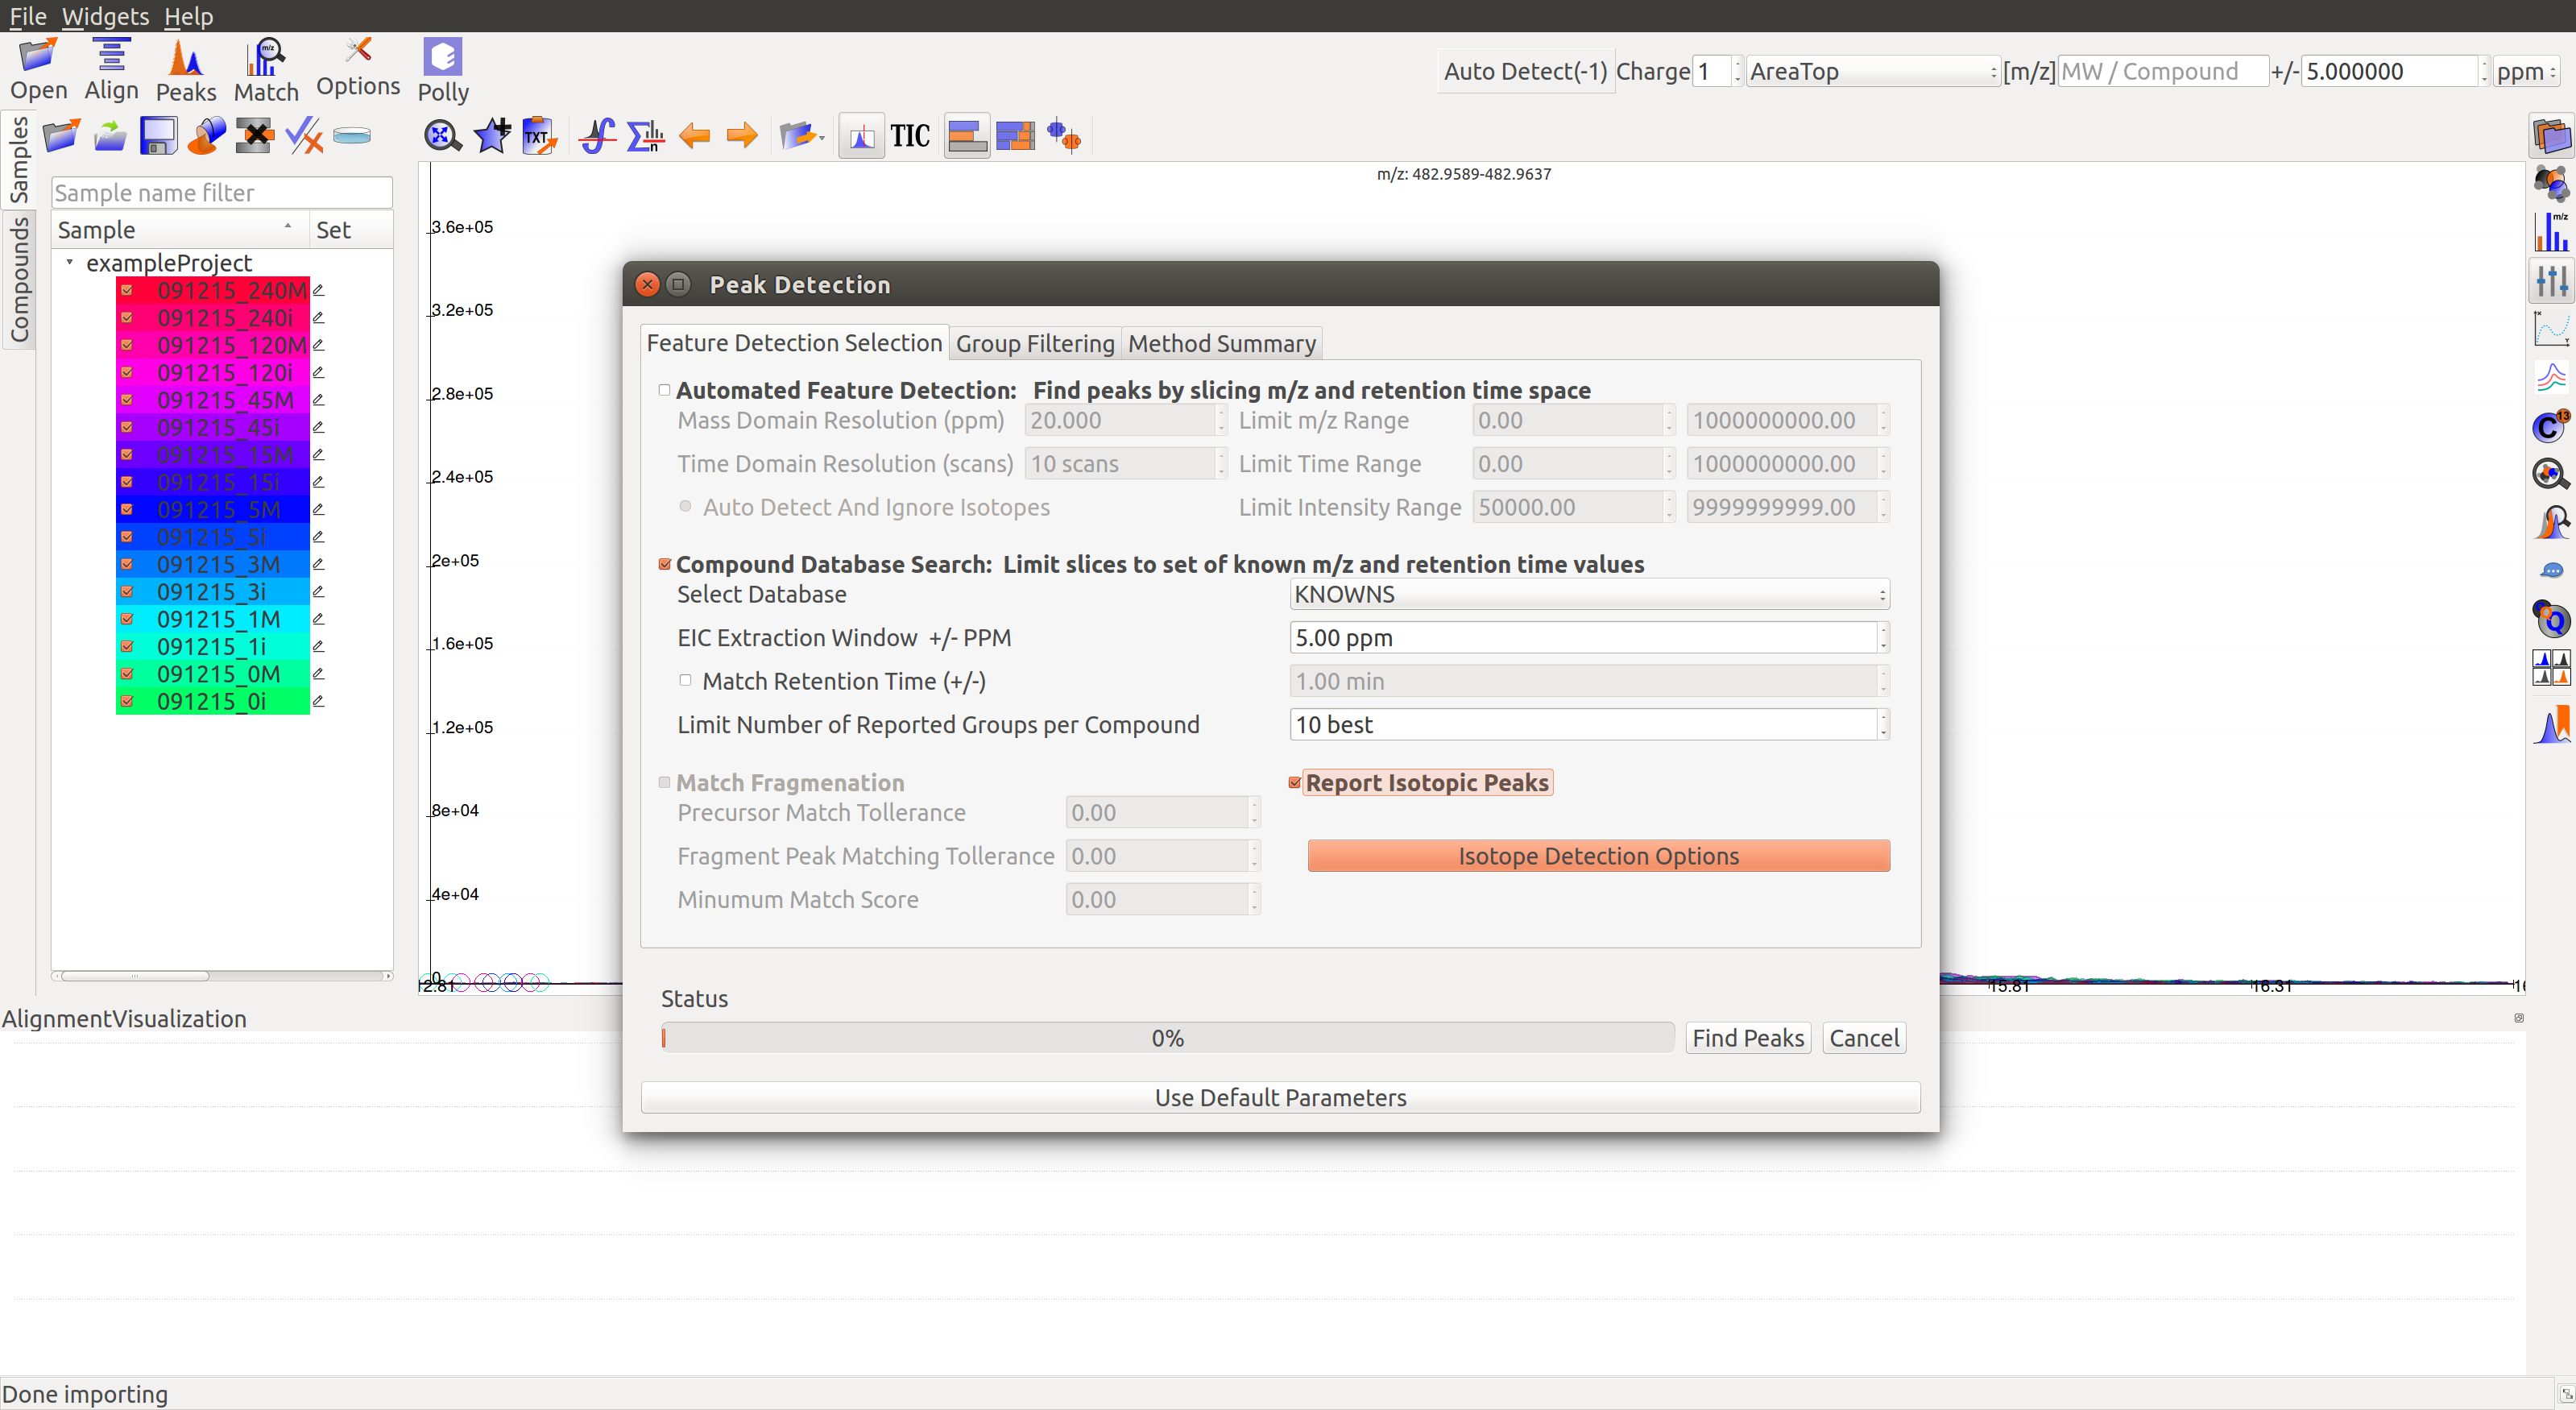
On opening the Feature Detection Selection tab, the Report Isotopic Peaks box must be checked. Clicking on the Isotope Detection Options gives the following window. Alternately, these settings can also be accessed from the Options dialog.
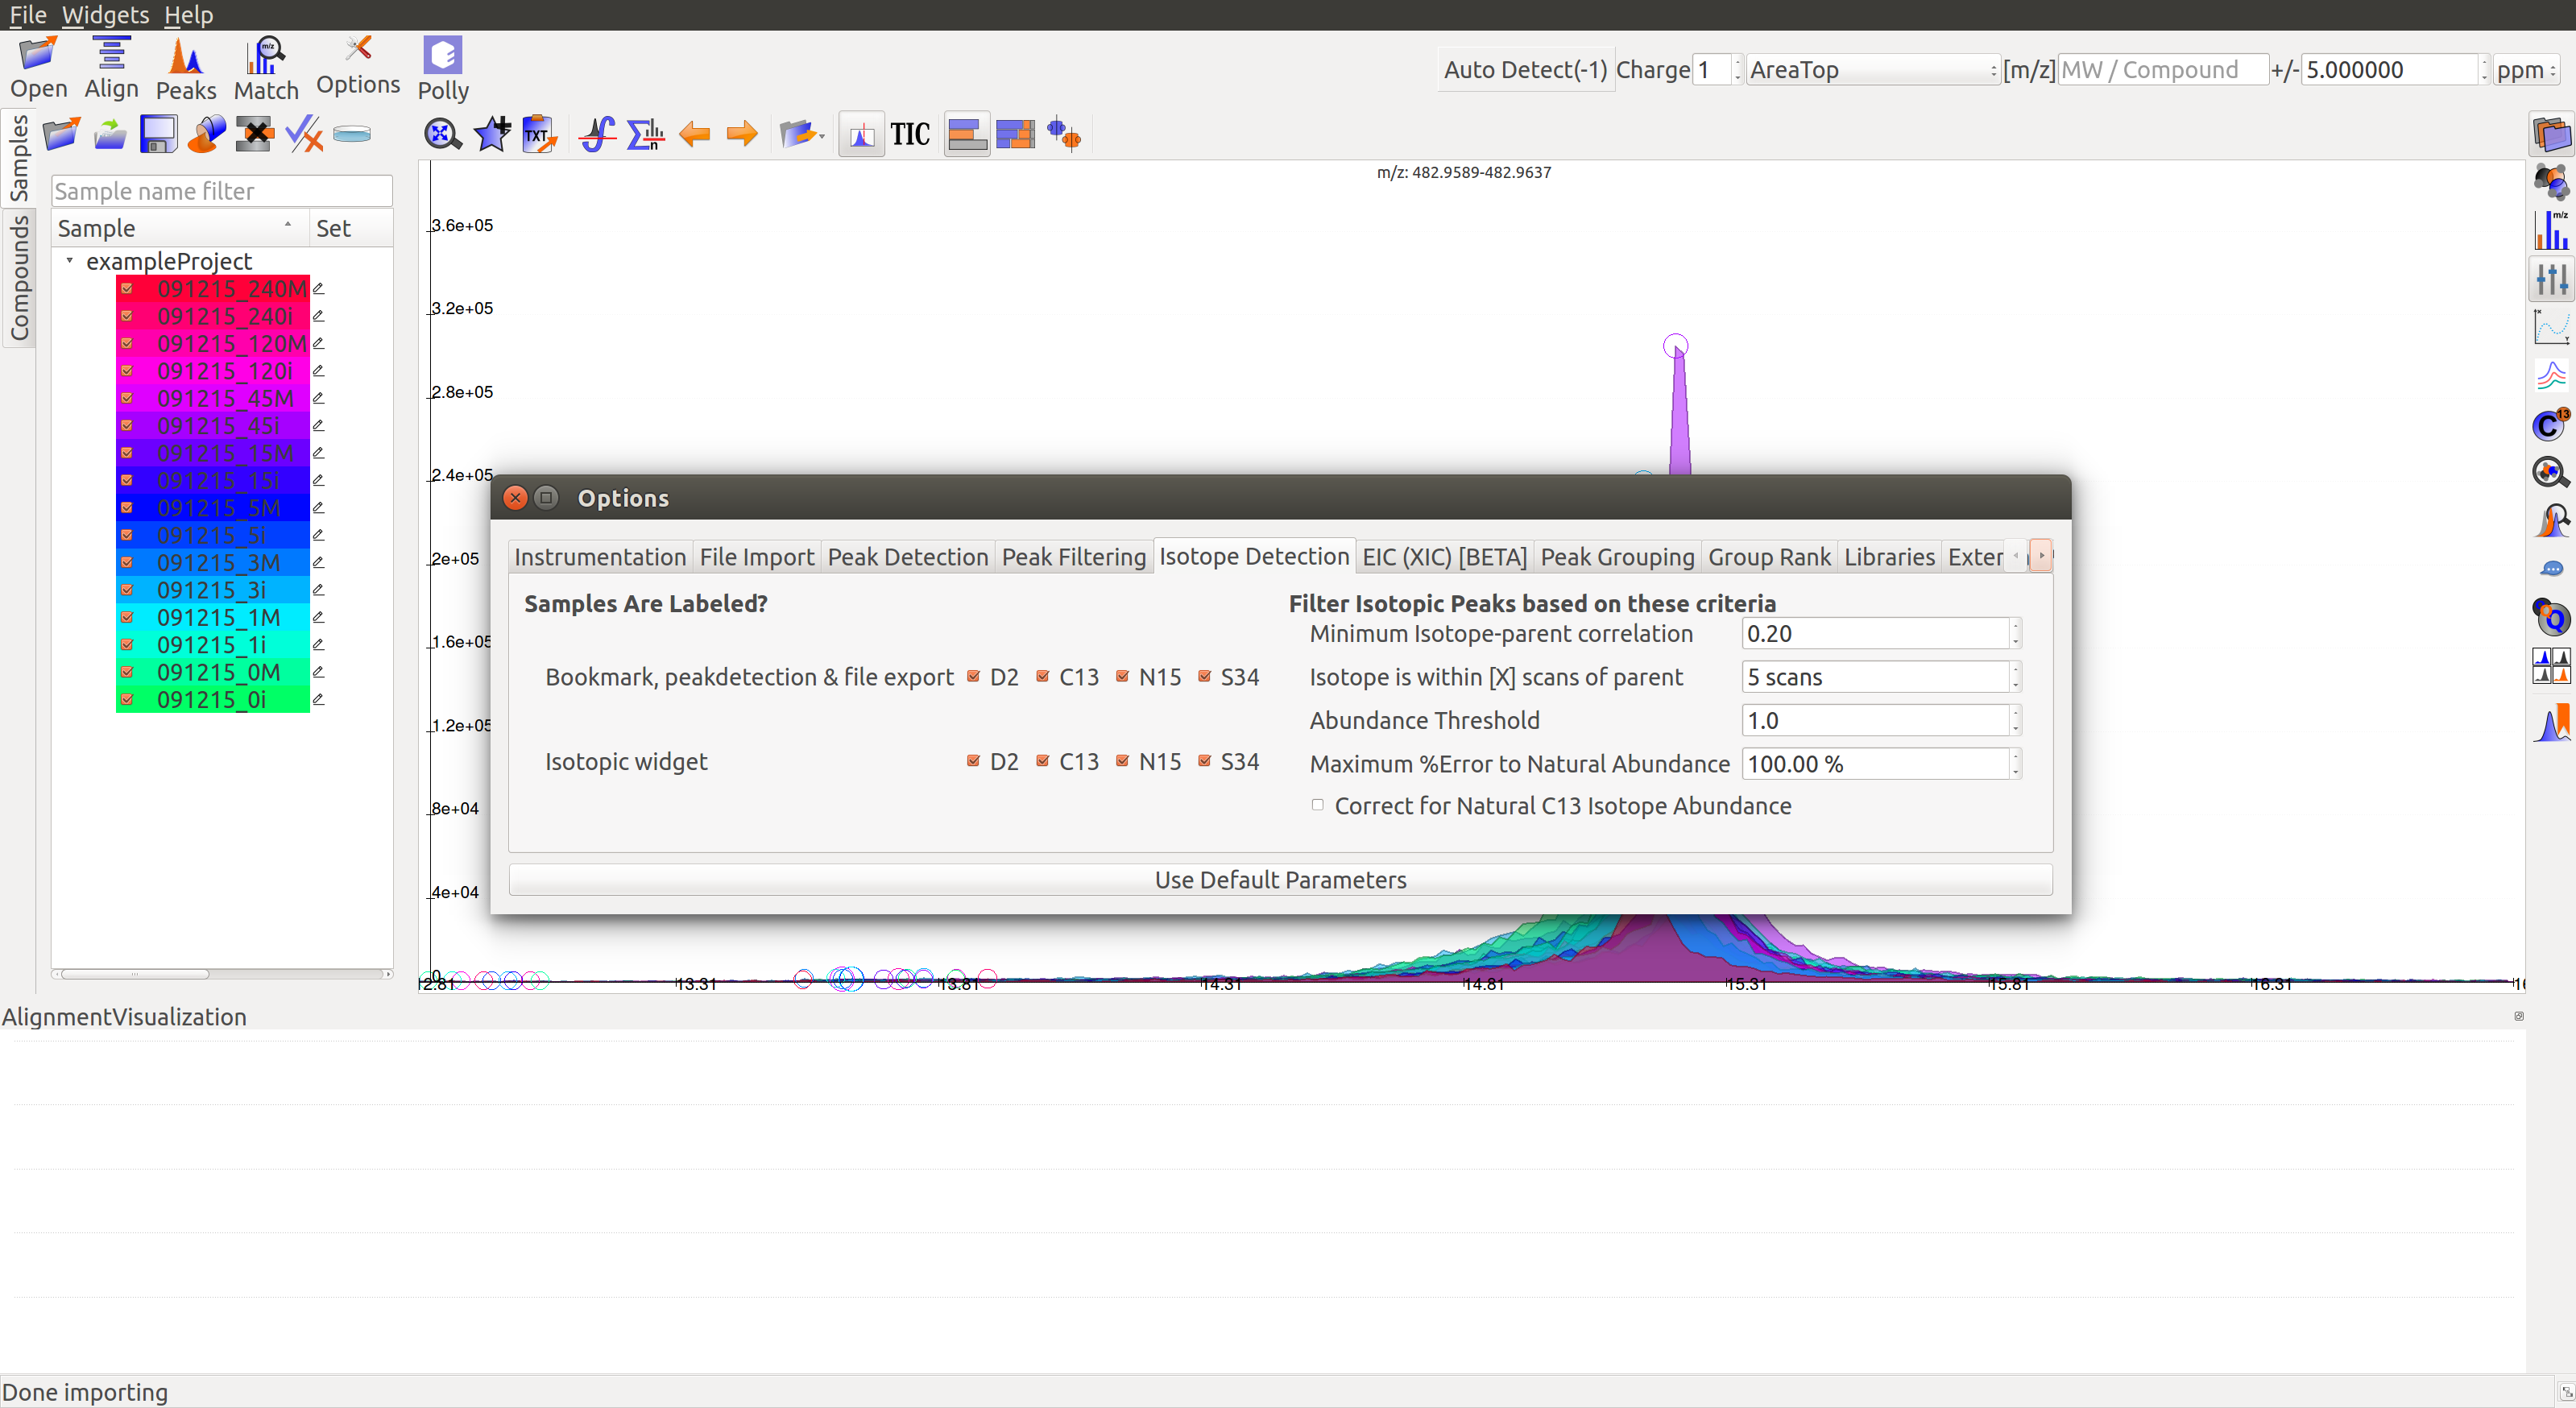
- Bookmarks, peak detection, file export: To select the labeled atoms that should be used in bookmarking, peak detection and export. D2: Deuterium, C13: Labeled carbon, N15: Labeled nitrogen, S34: Labeled sulphur.
- Isotopic widget: To select the labeled atoms that should be displayed in the isotopic widget. D2: Deuterium, C13: Labeled carbon, N15: Labeled nitrogen, S34: Labeled sulphur.
- Number of M+n isotopes: To set the maximum number of labeled atoms per ion in the experiment.
- Abundance Threshold: To set the minimum threshold for isotopic abundance. Isotopic abundance is the ratio of intensity of isotopic peak over the parent peak.
Filter Isotopic Peaks based on these criteria
- Minimum Isotope-Parent Correlation: To set the minimum threshold for isotope-parent peak correlation. This correlation is a measure of how often they appear together.
- Isotope is within [X] scans of parent: To set the maximum scan difference between isotopic and parent peaks. This is a measure of how closely they appear together on the retention time scale.
- Maximum % Error to Natural Abundance: To set the maximum natural abundance error expected. Natural abundance of an isotope is the expected ratio of amount of isotope over the amount of parent molecule in nature. Error is the difference between observed and natural abundance as a fraction of natural abundance.
- Correct for Natural C13 Isotope Abundance: The box should be checked to correct for natural C13 abundance.
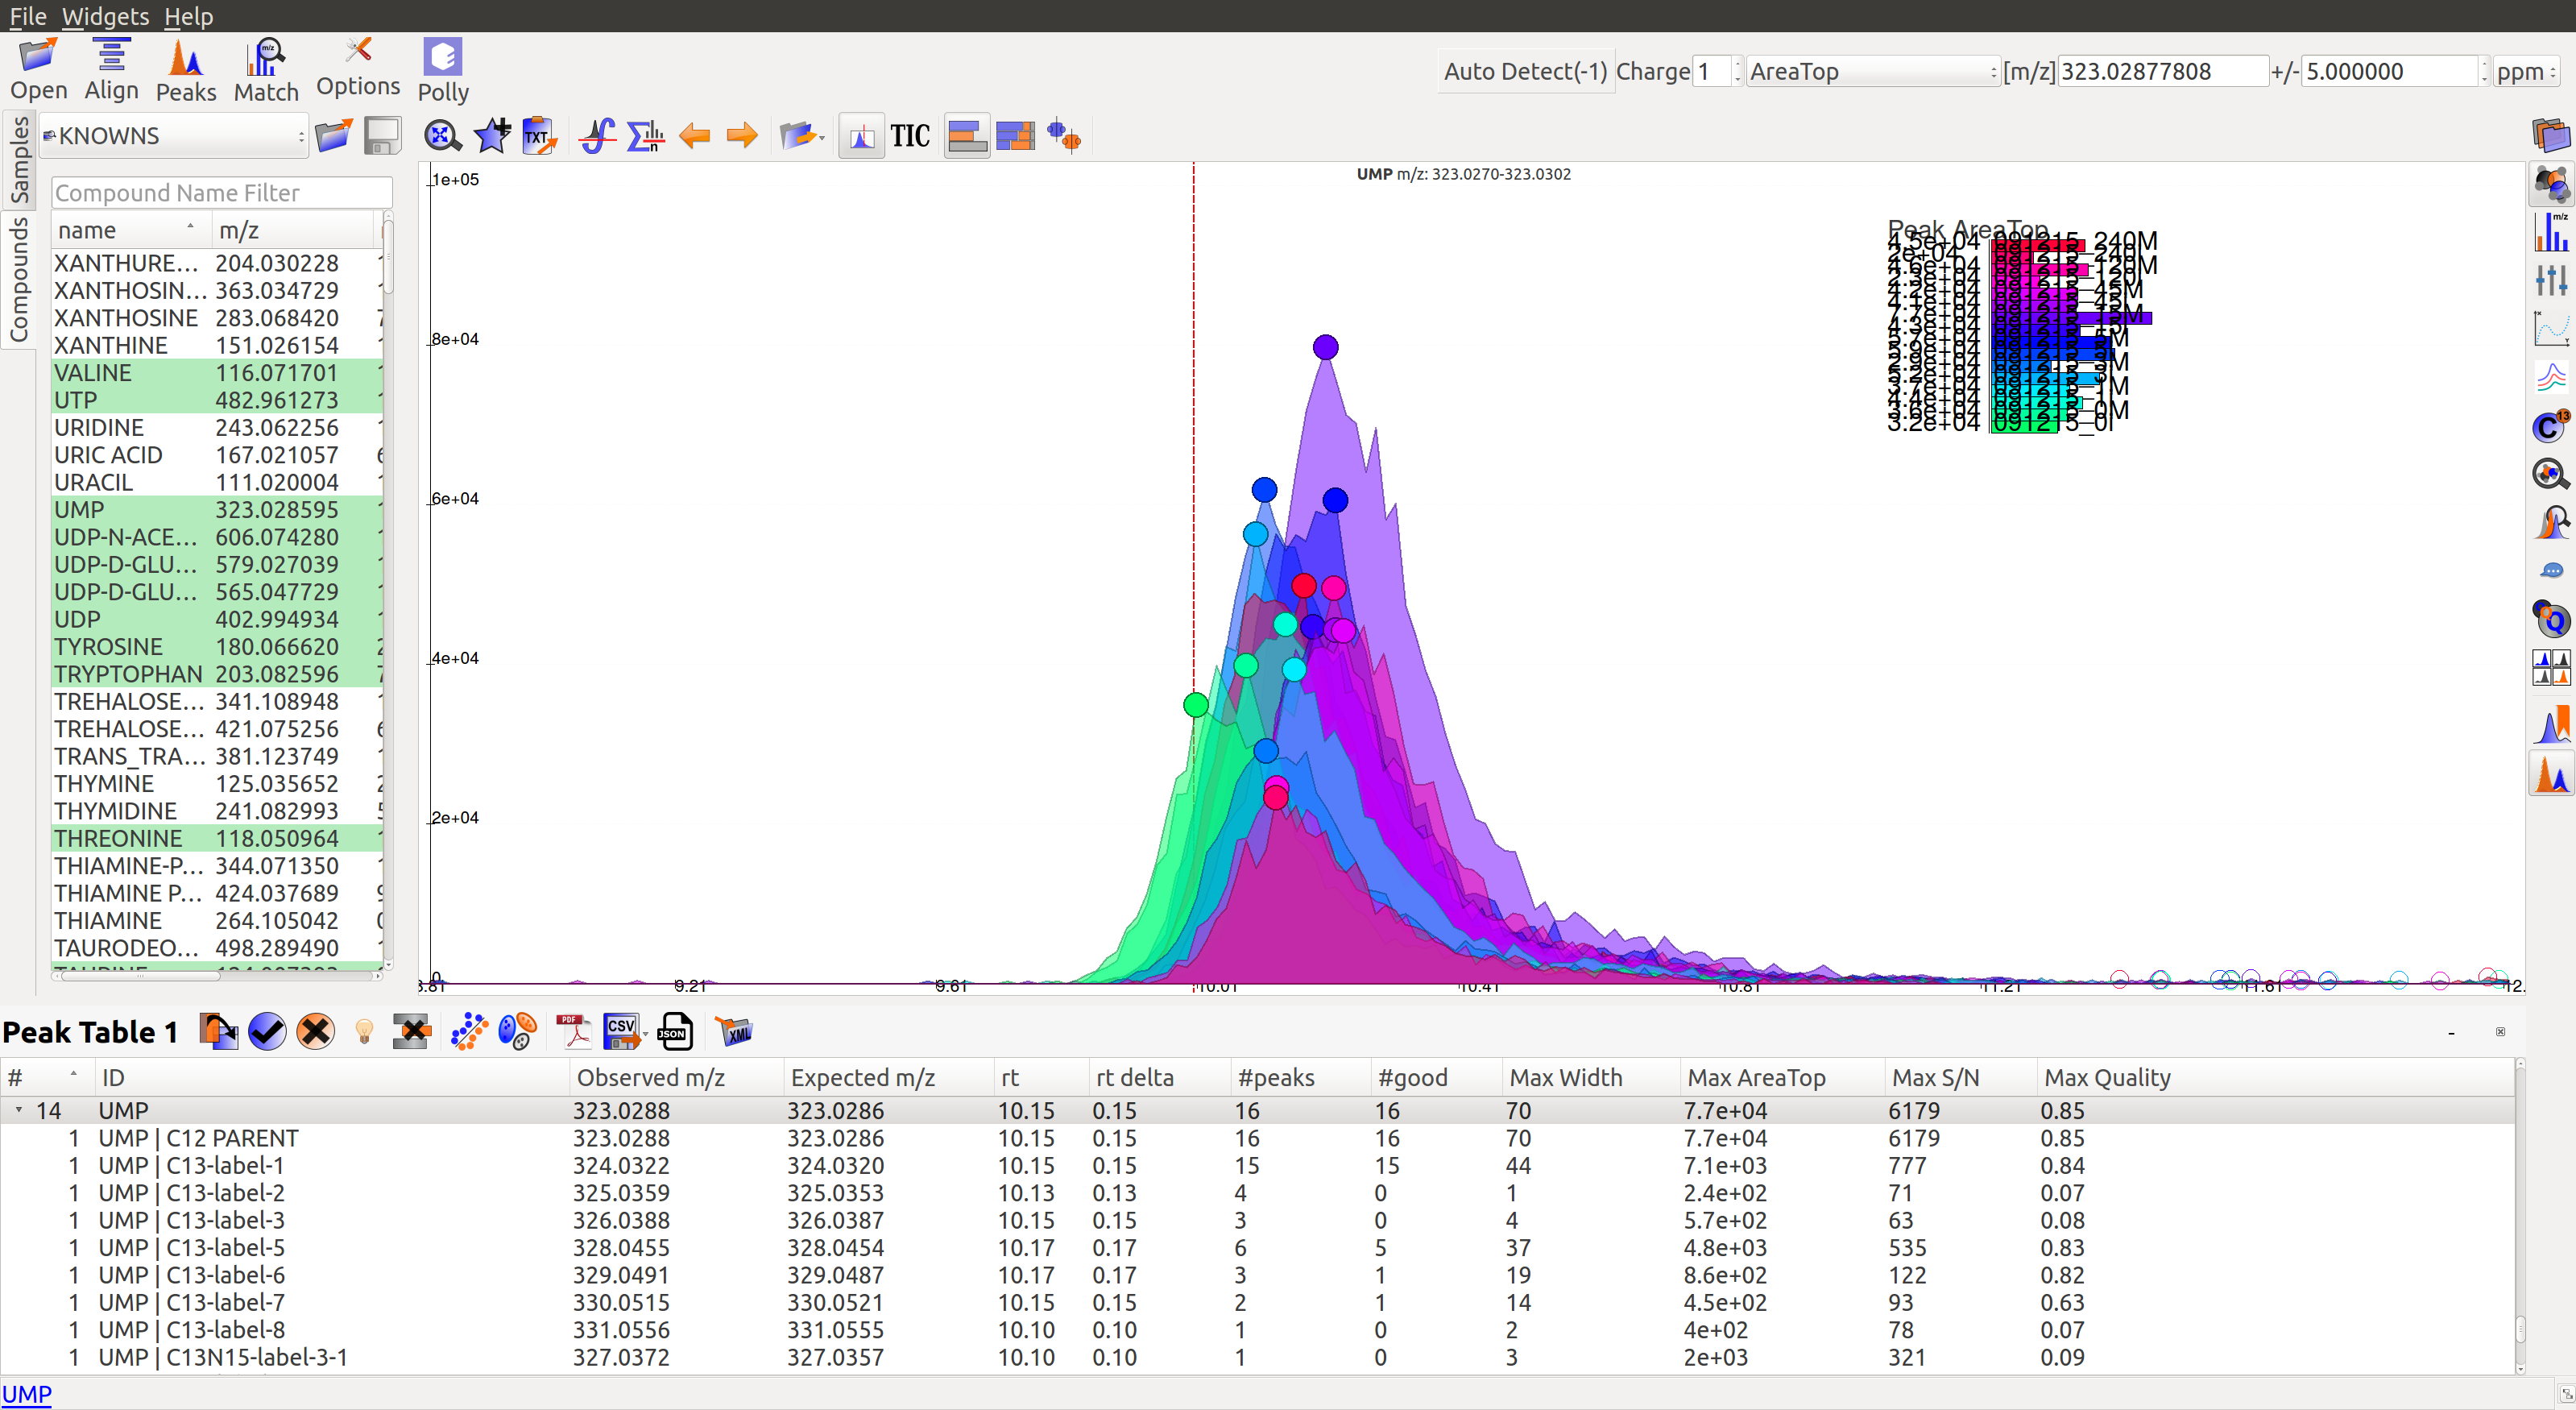
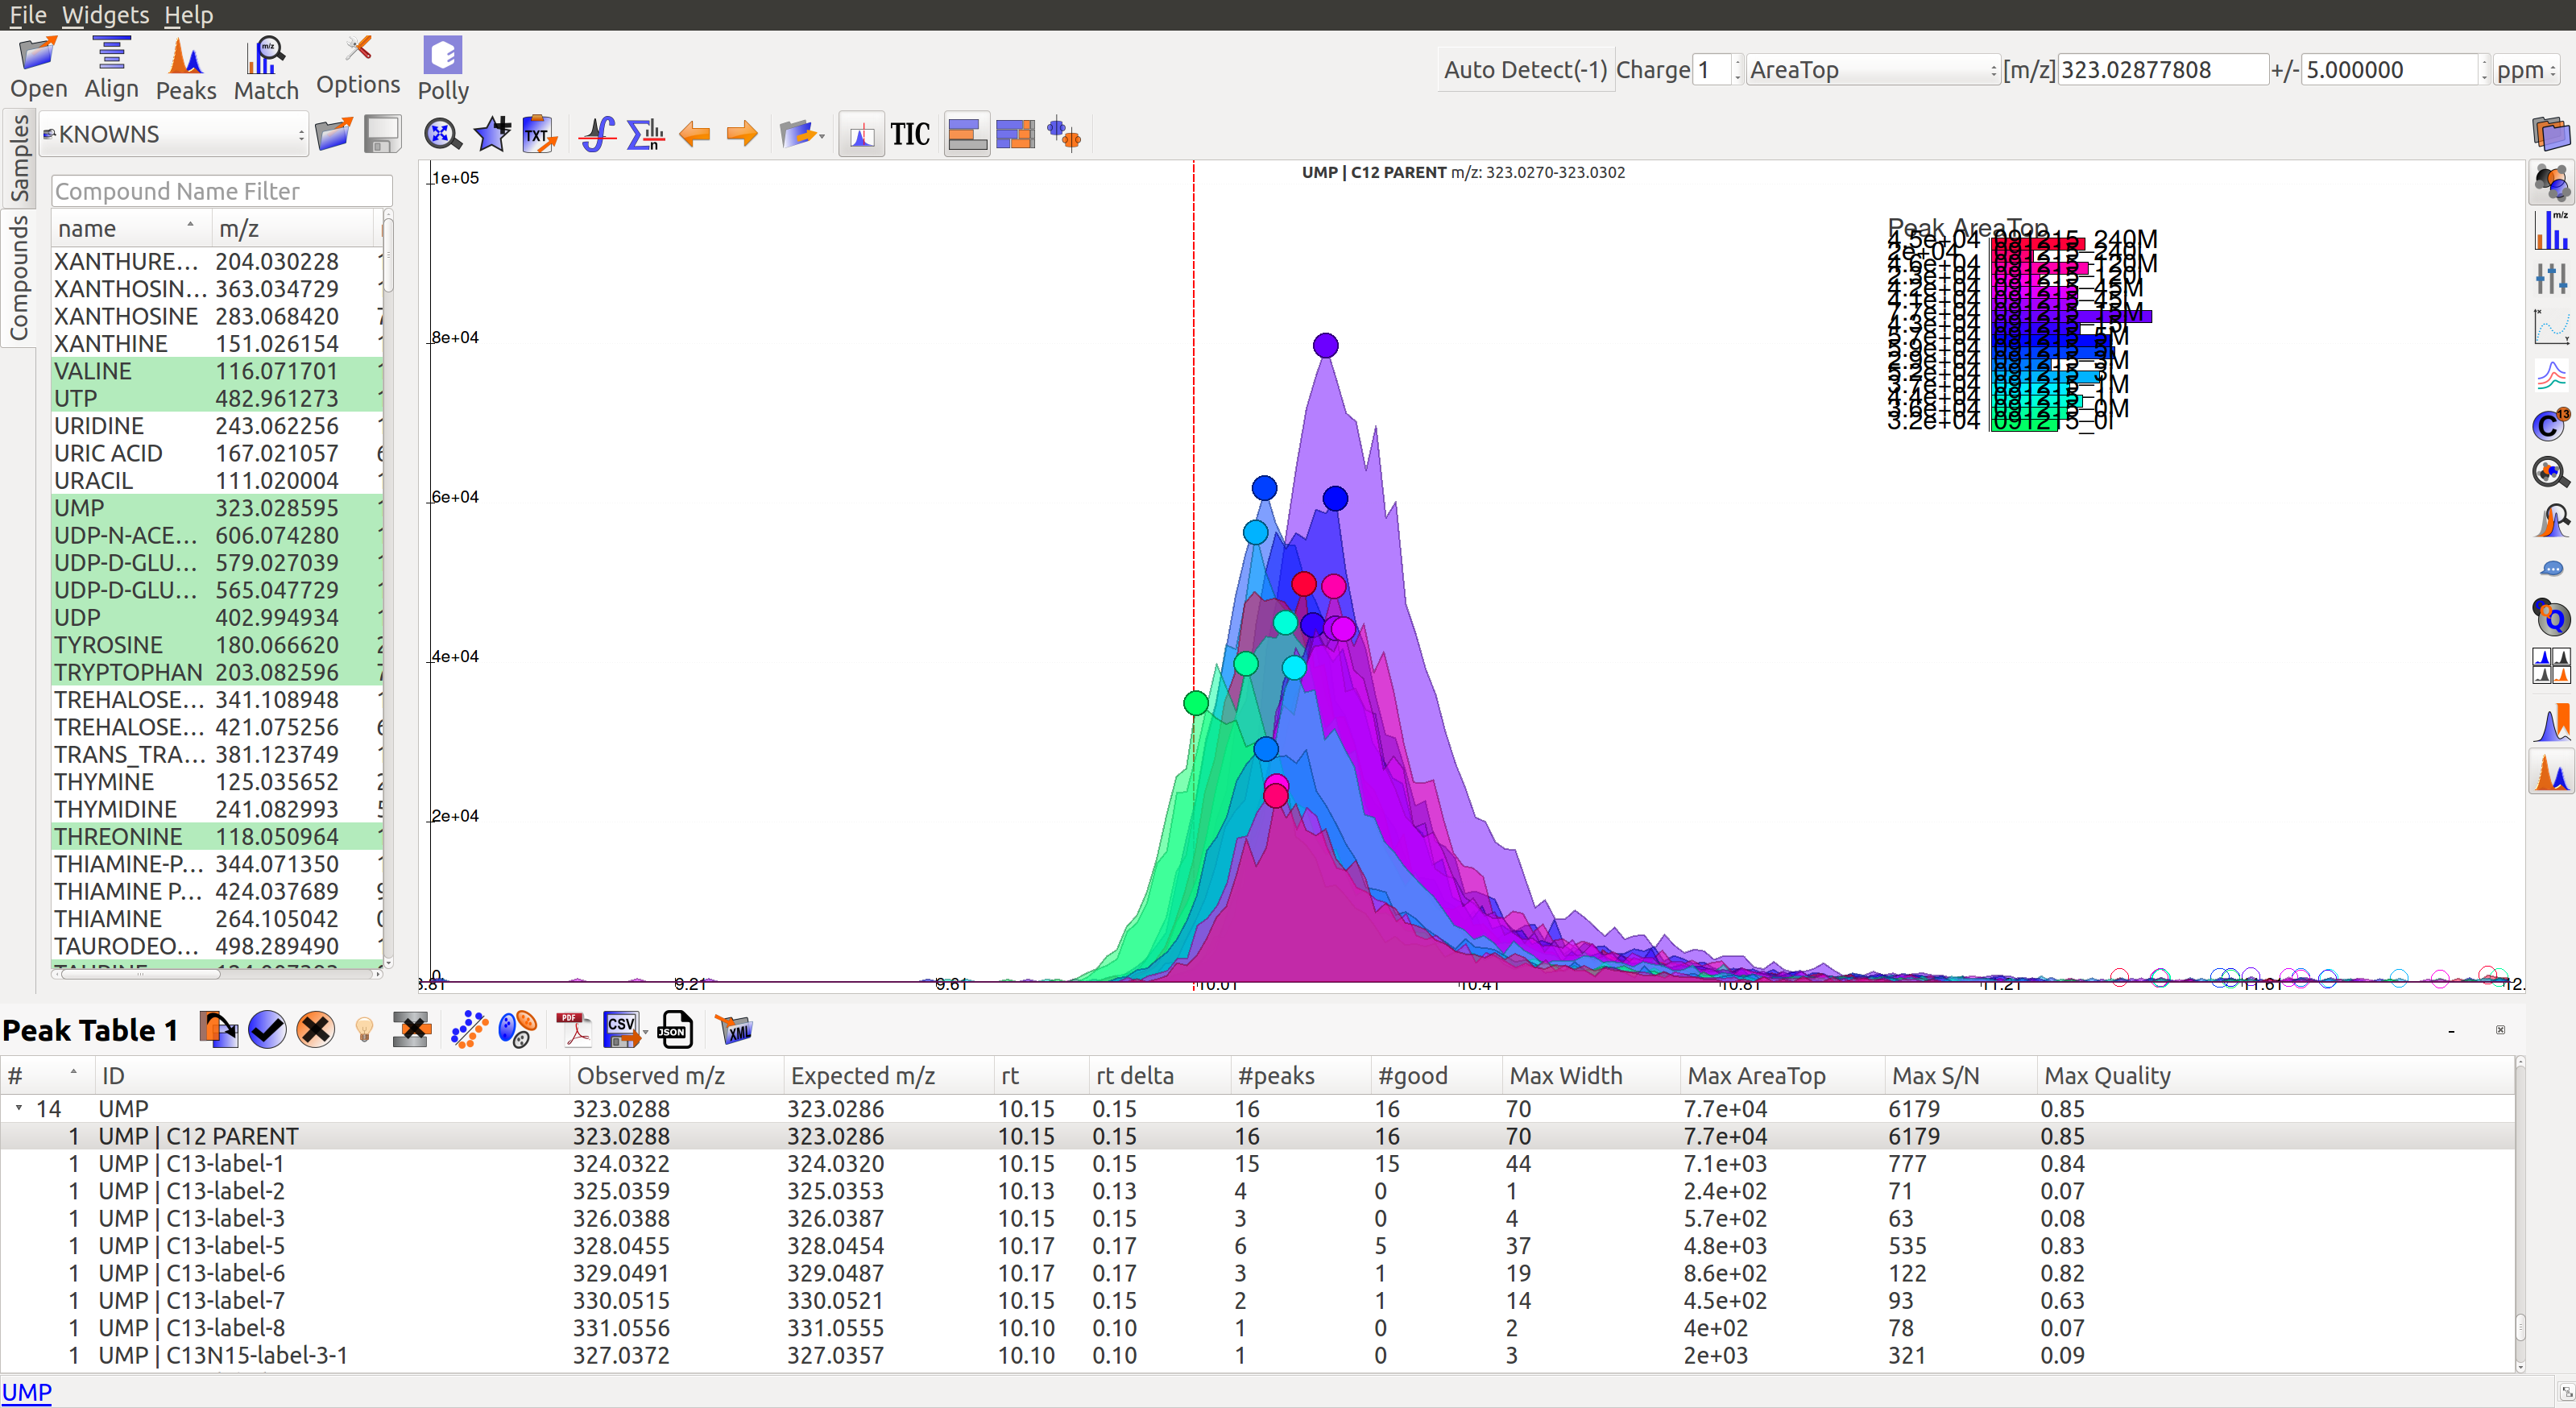
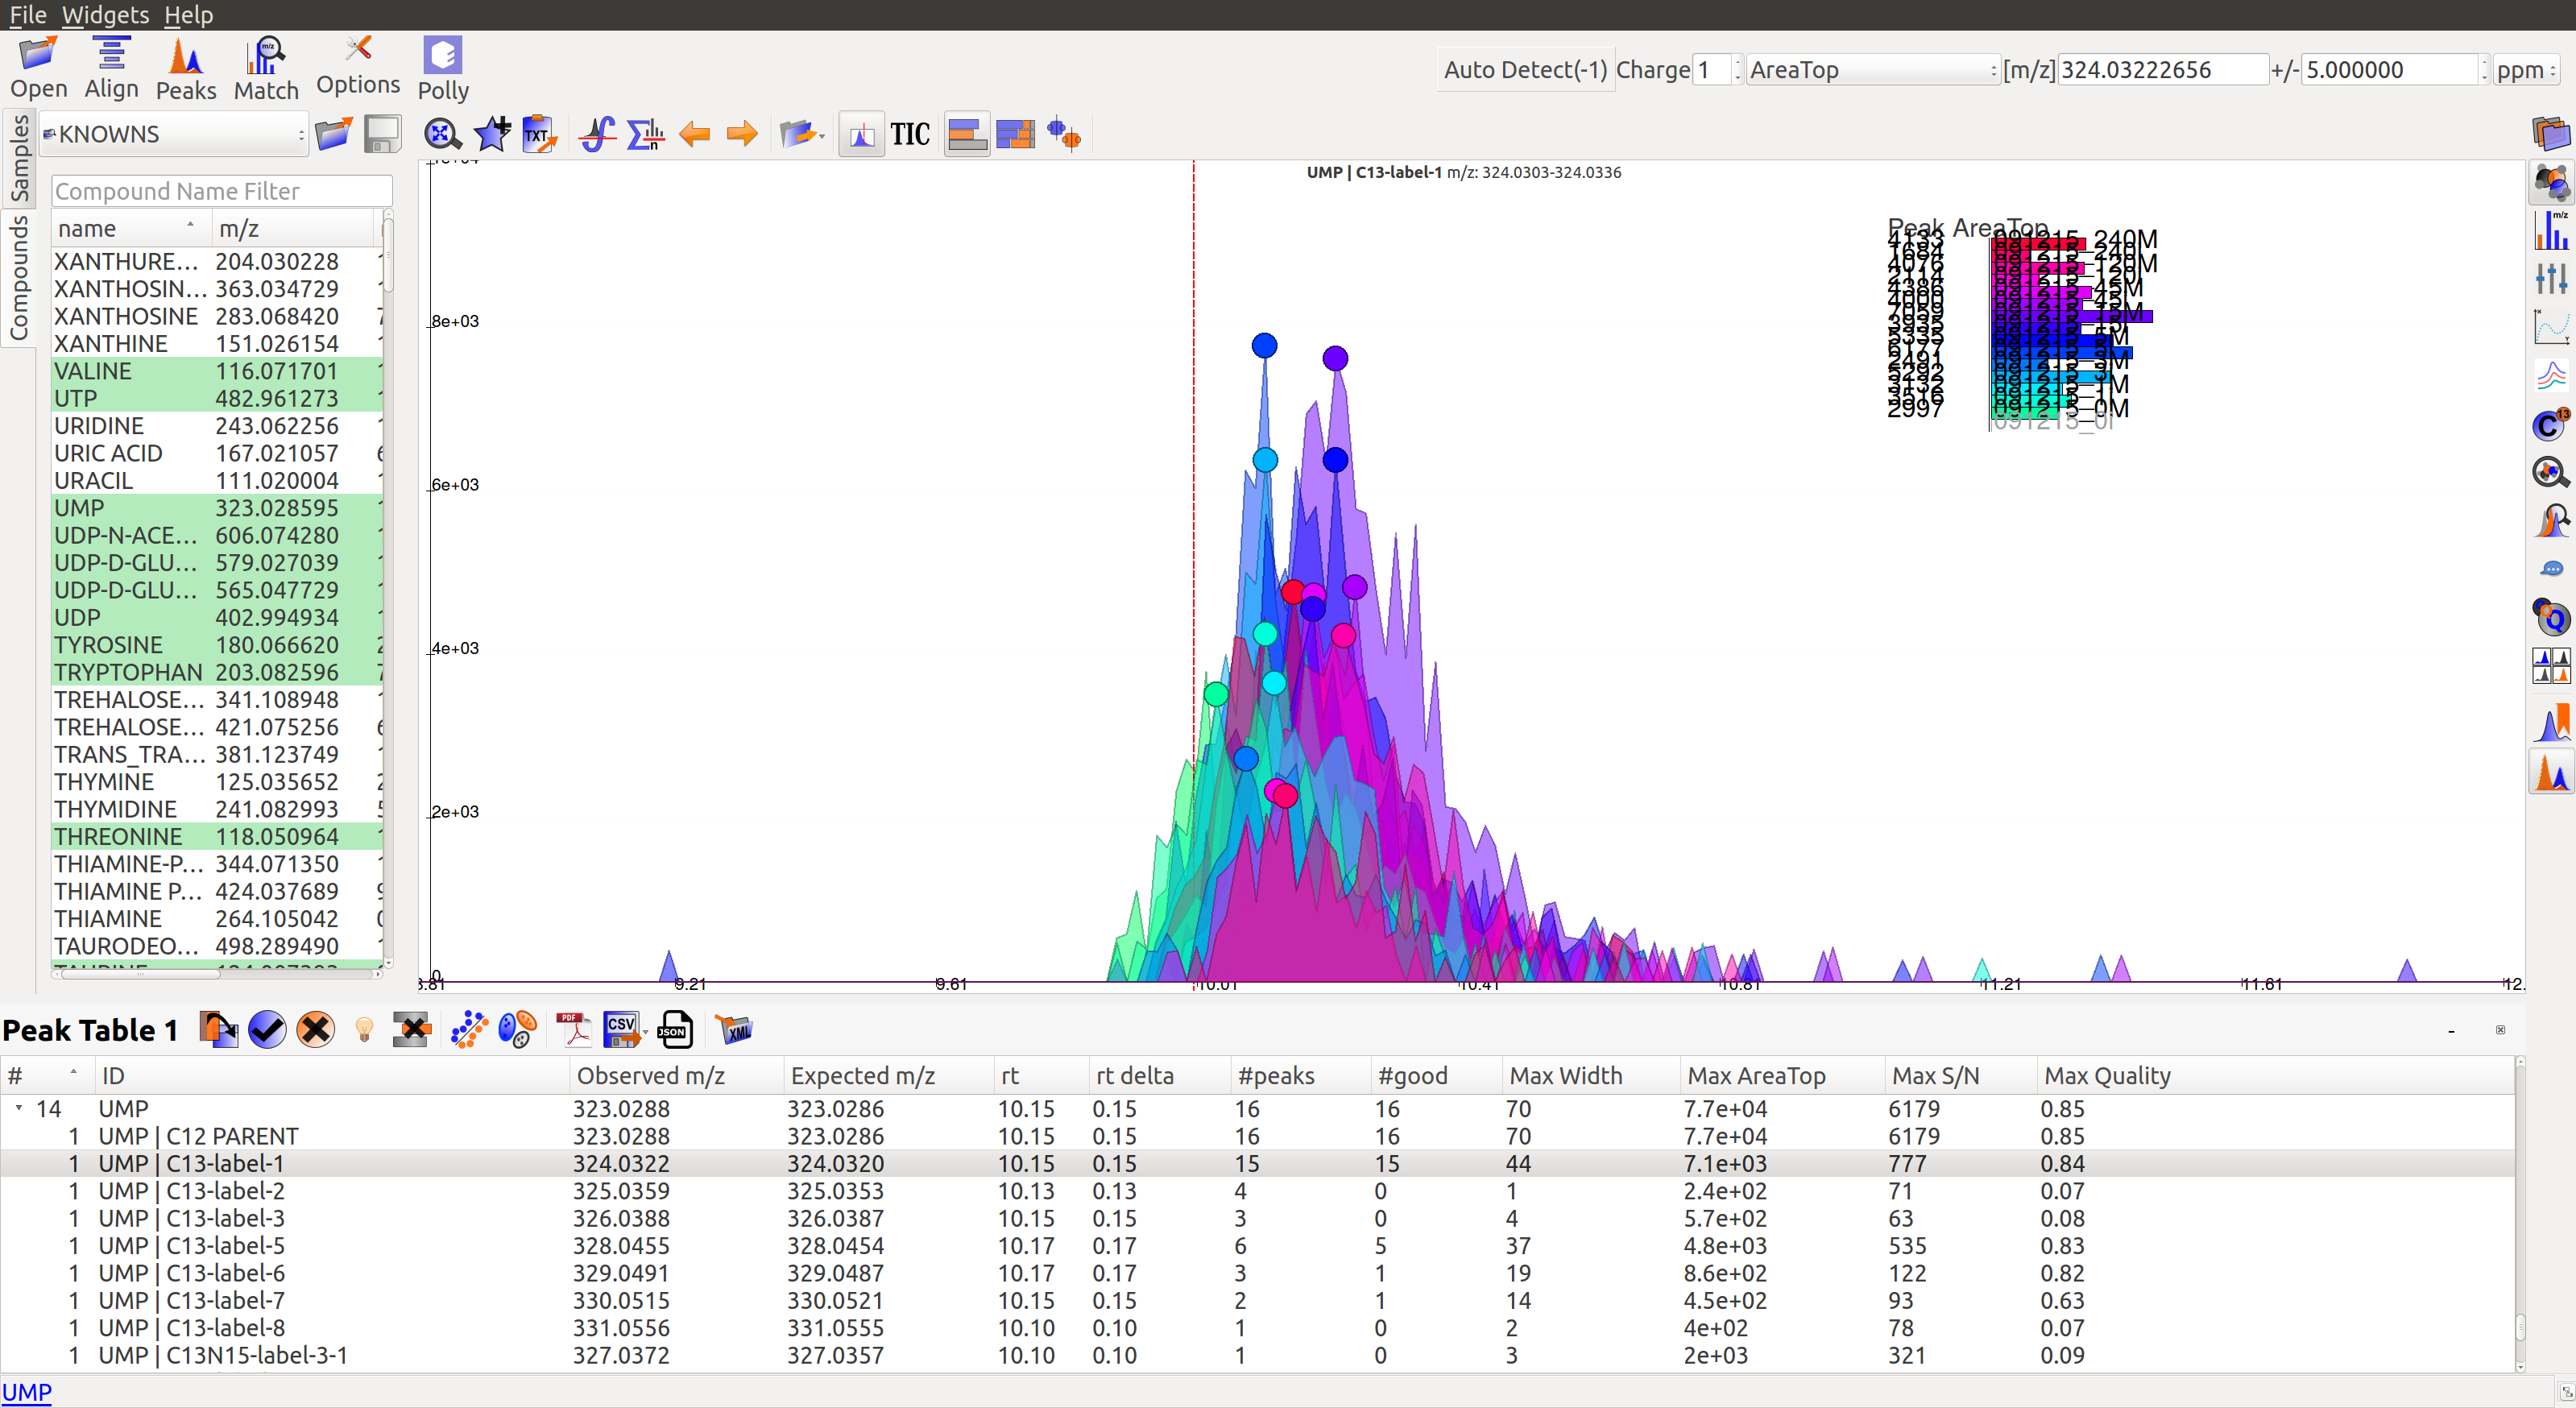
In the image below, Peak Table 3 has a drop down button with metabolites that shows all labeled isotopologues of that particular metabolite.
Show Isotope Plots
This icon  on top displays the isotope plots for a group. The red colored bar plot for UTP group is shown below. Each bar in the plot represents the relative percentage of different isotopic species for the selected group in a sample.
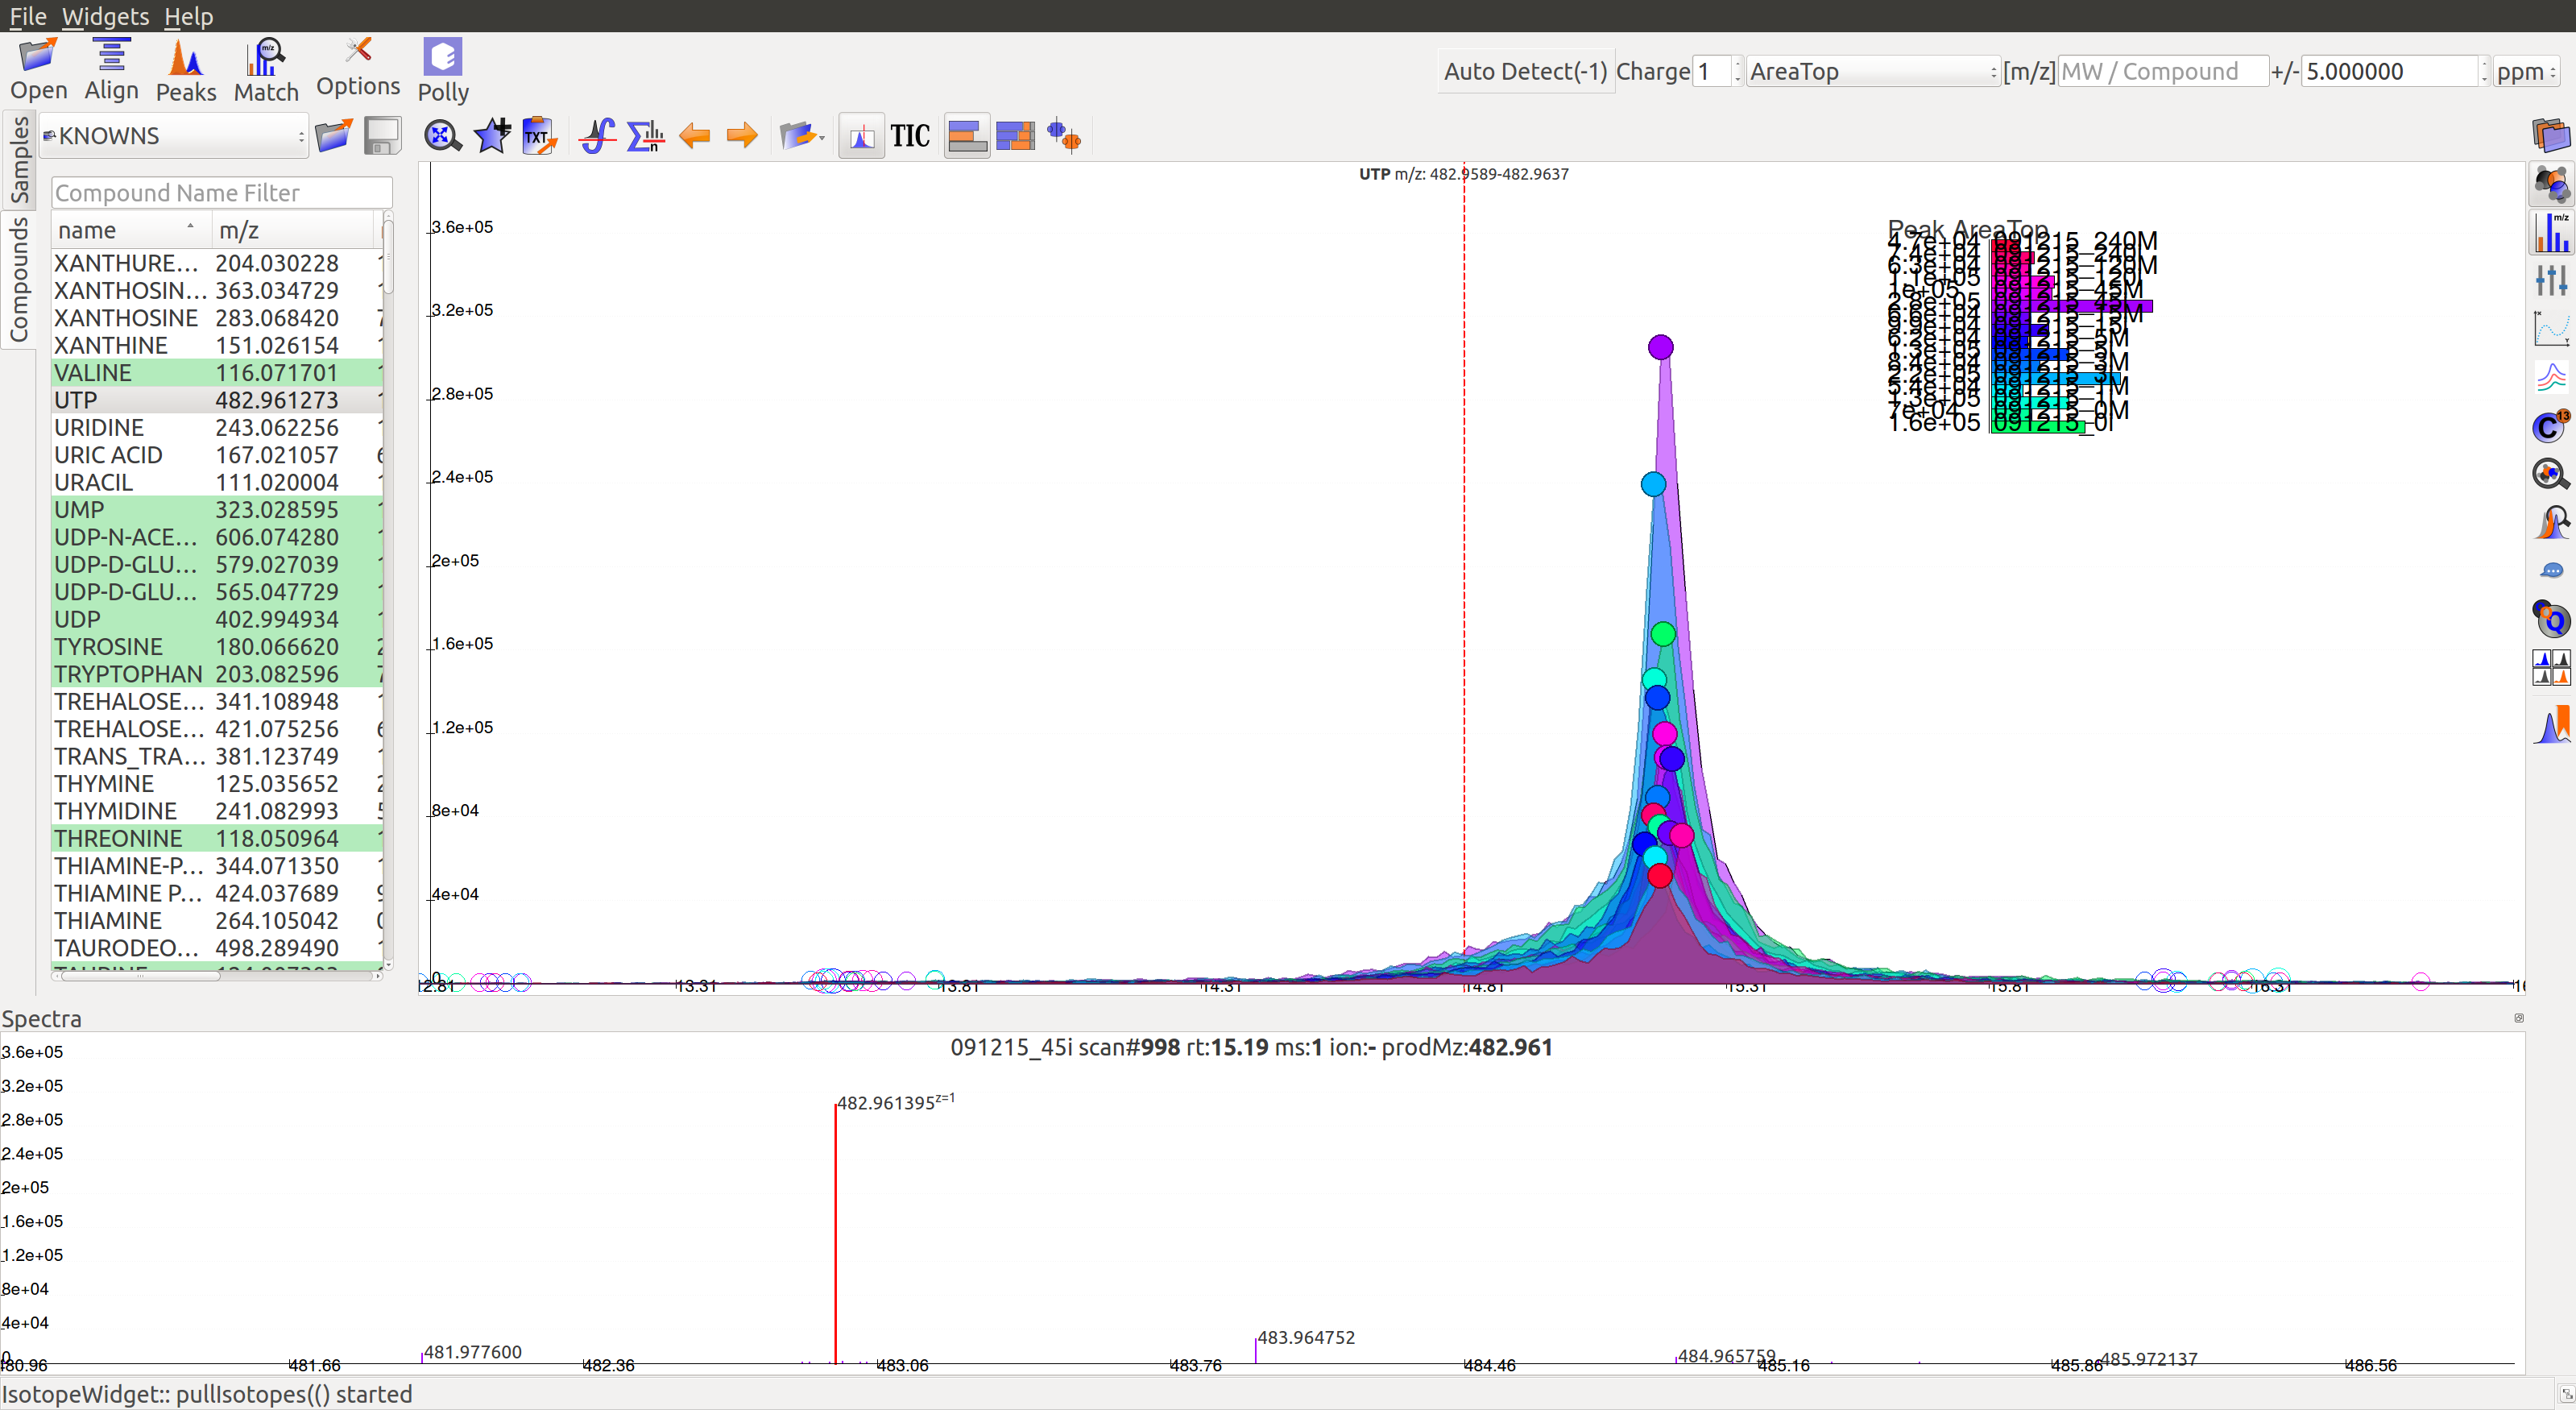
Mass Spectra
Mass Spectra Widget  displays each peak, its mass, and intensity for a scan. As the widget shows all detected masses in a scan, the ppm window for the EIC and consequently grouping can be adjusted accordingly. This feature is especially useful for MS/MS data and isotopic detection.
Peak Curation
Generally there are two broad workflows to curate peaks in El-MAVEN:
- Manual Peak Curation using Compound DB widget
- Automated Peak Curation
Although, for labeled data Automatic Peak Curation is not meaningful because it will not curate any labeled groups.
Manual Peak Curation using Compound DB widget
Clicking the Peaks icon on the top opens the settings dialog.

Users must check the box for Report Isotopic Peaks in the Group Filtering tab.
Note
Users should not click on Find Peaks after checking the box for manual curation. Clicking on that option would start Automatic Peak Detection. For adjusting other settings, users can access them through the Options dialog .
For more details on how to access Peak Detection settings, read this Widgets page.
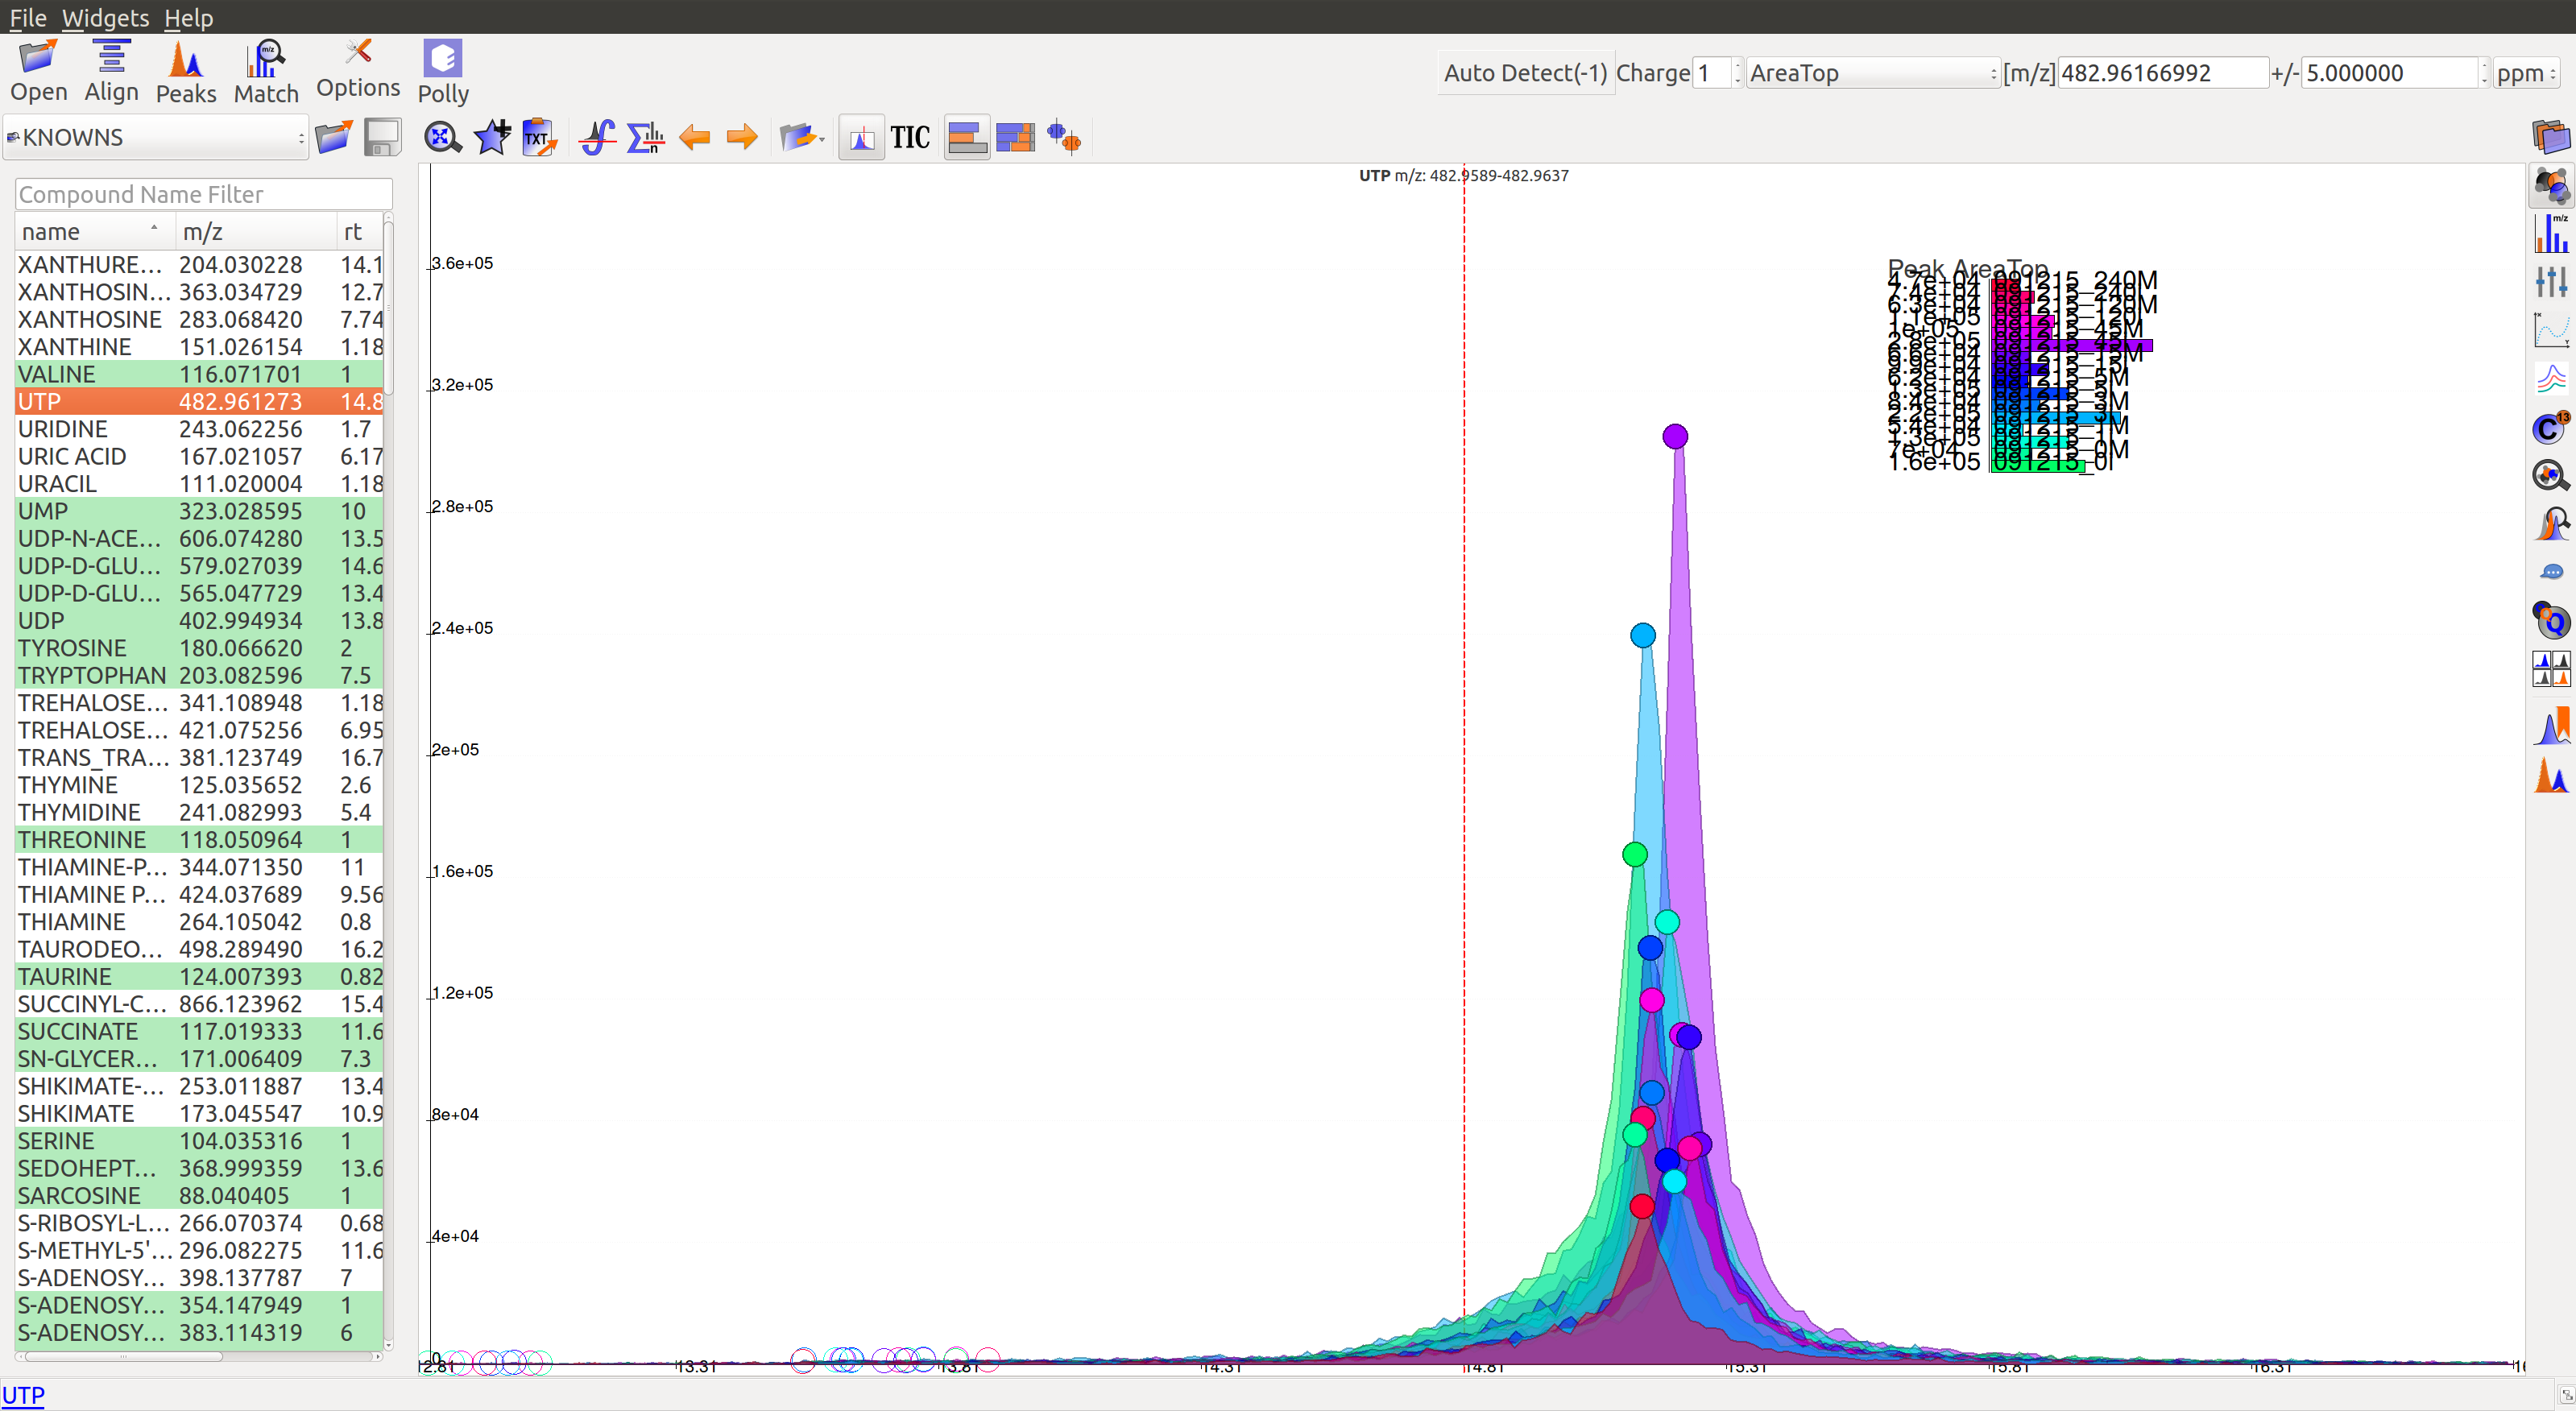
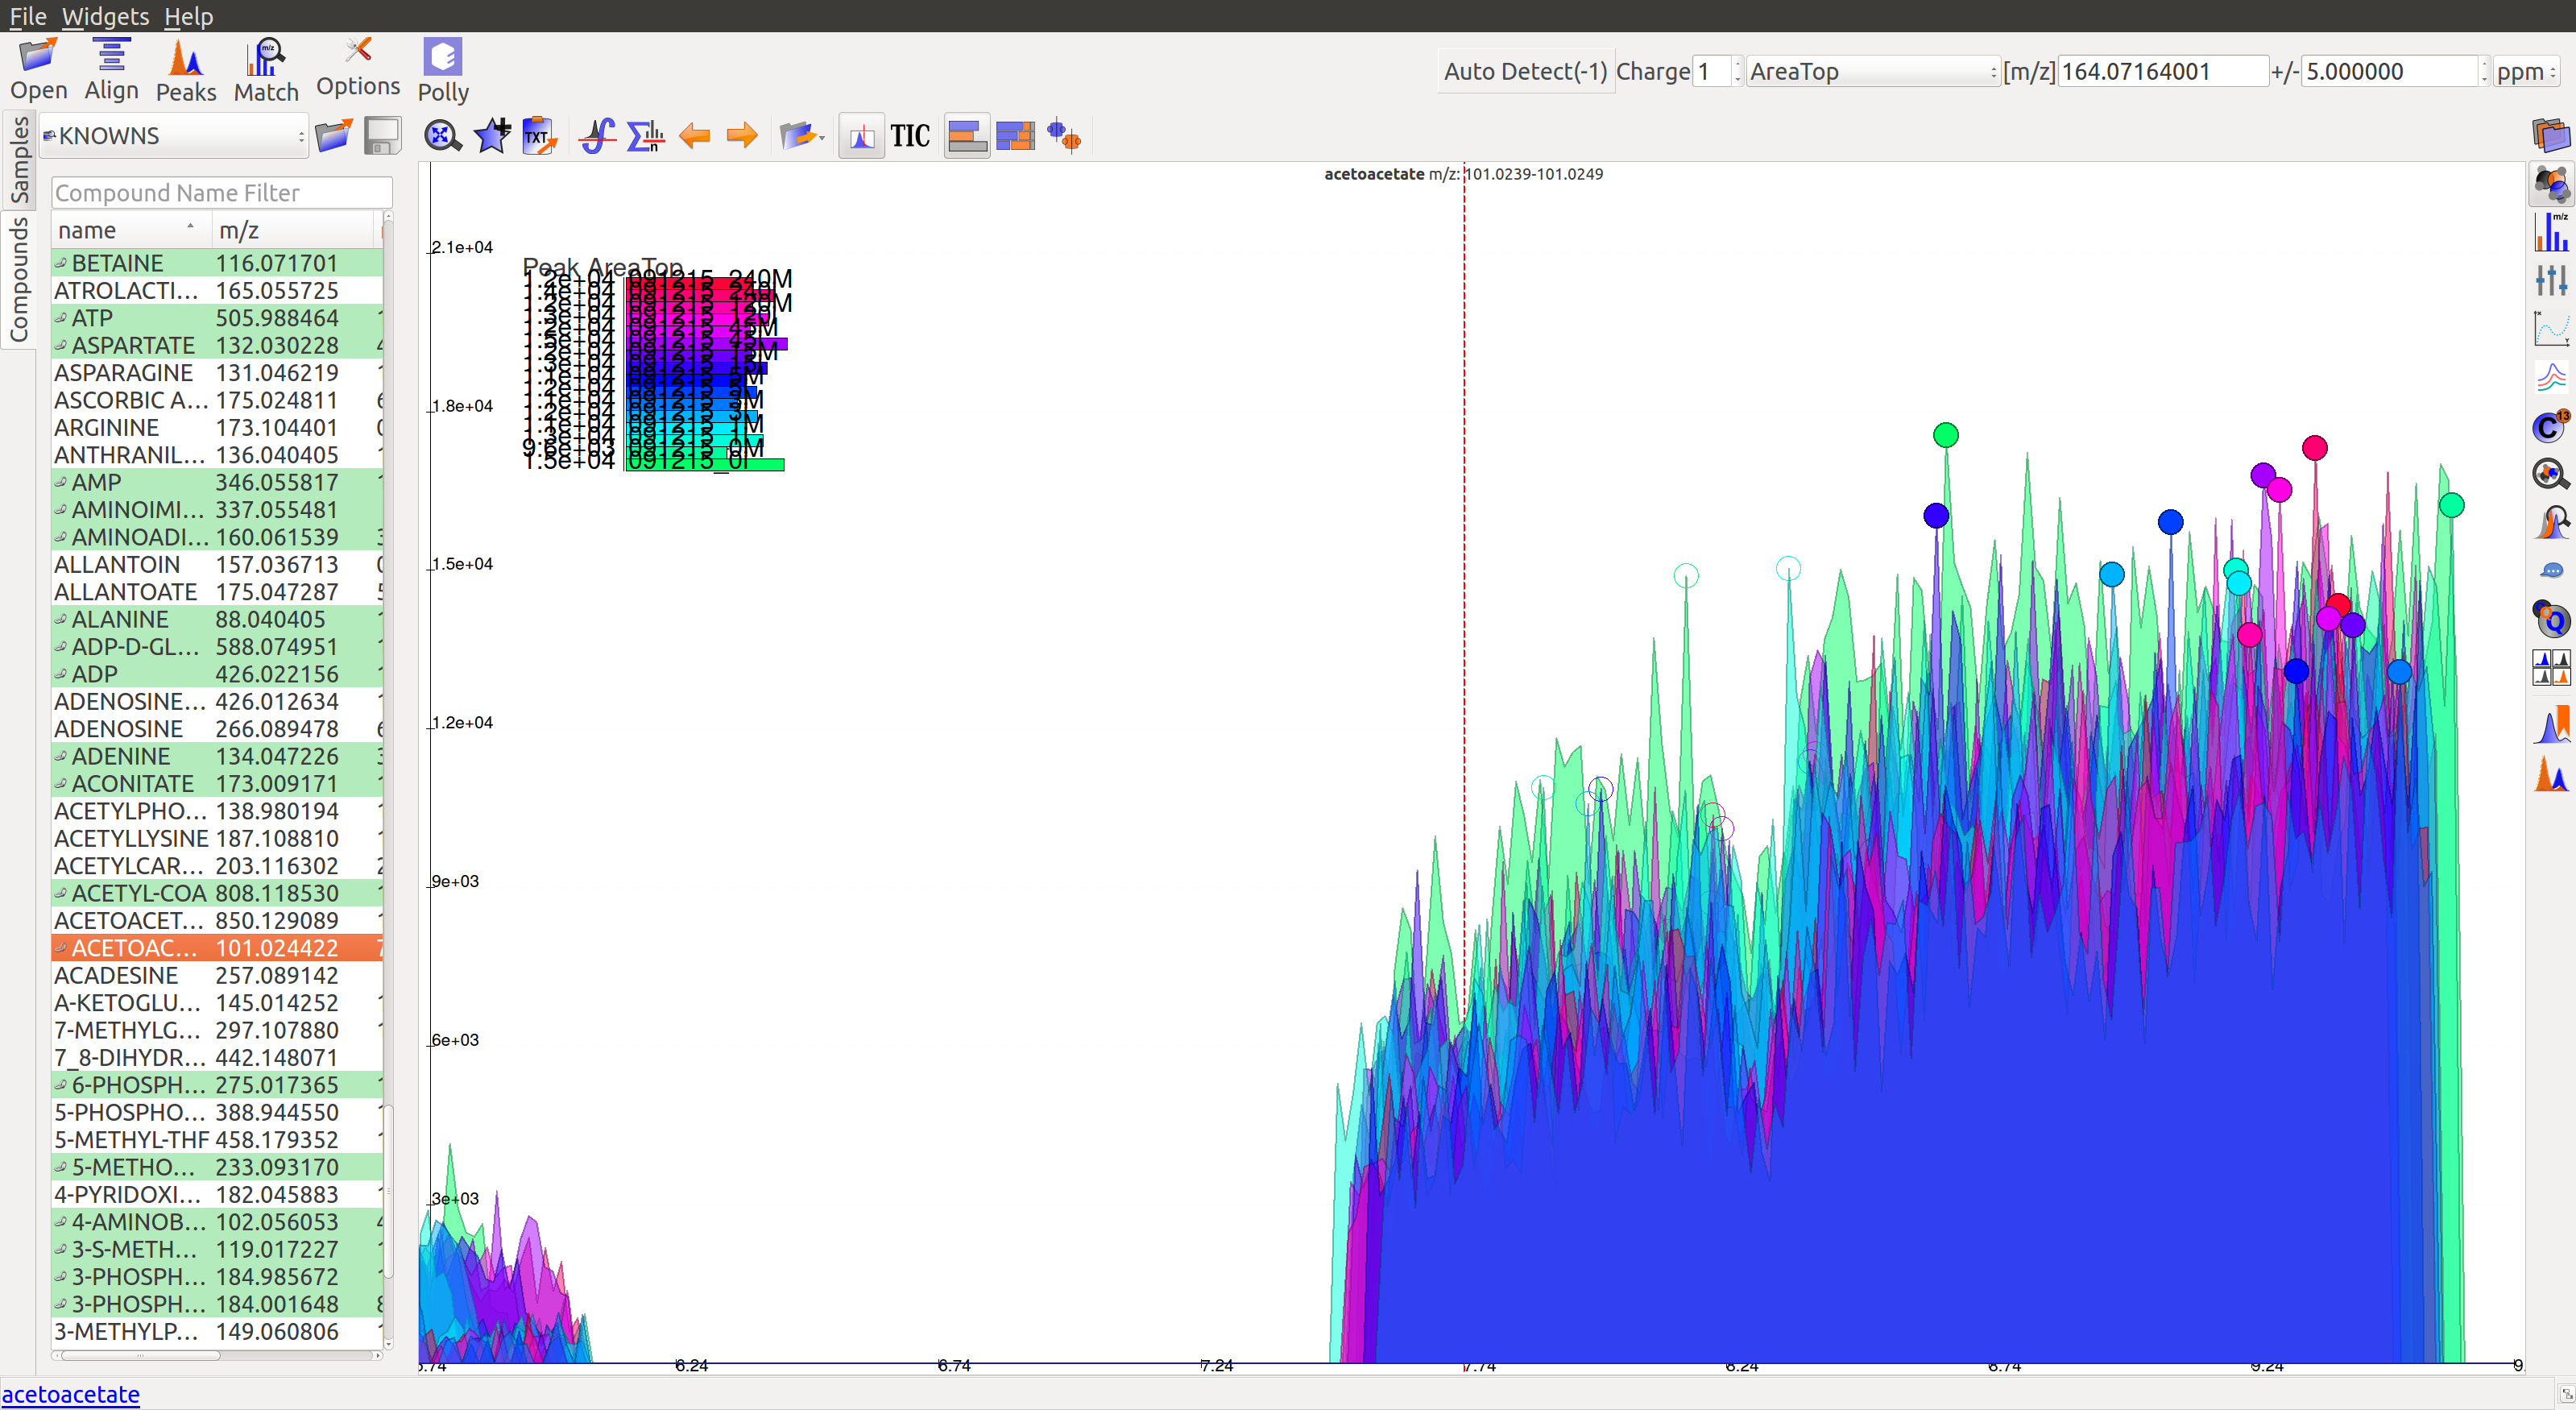
To use manual curation using the compound DB widget, users have to iterate over all the compounds in the compound DB on the extreme left of the window, as highlighted in the images below.
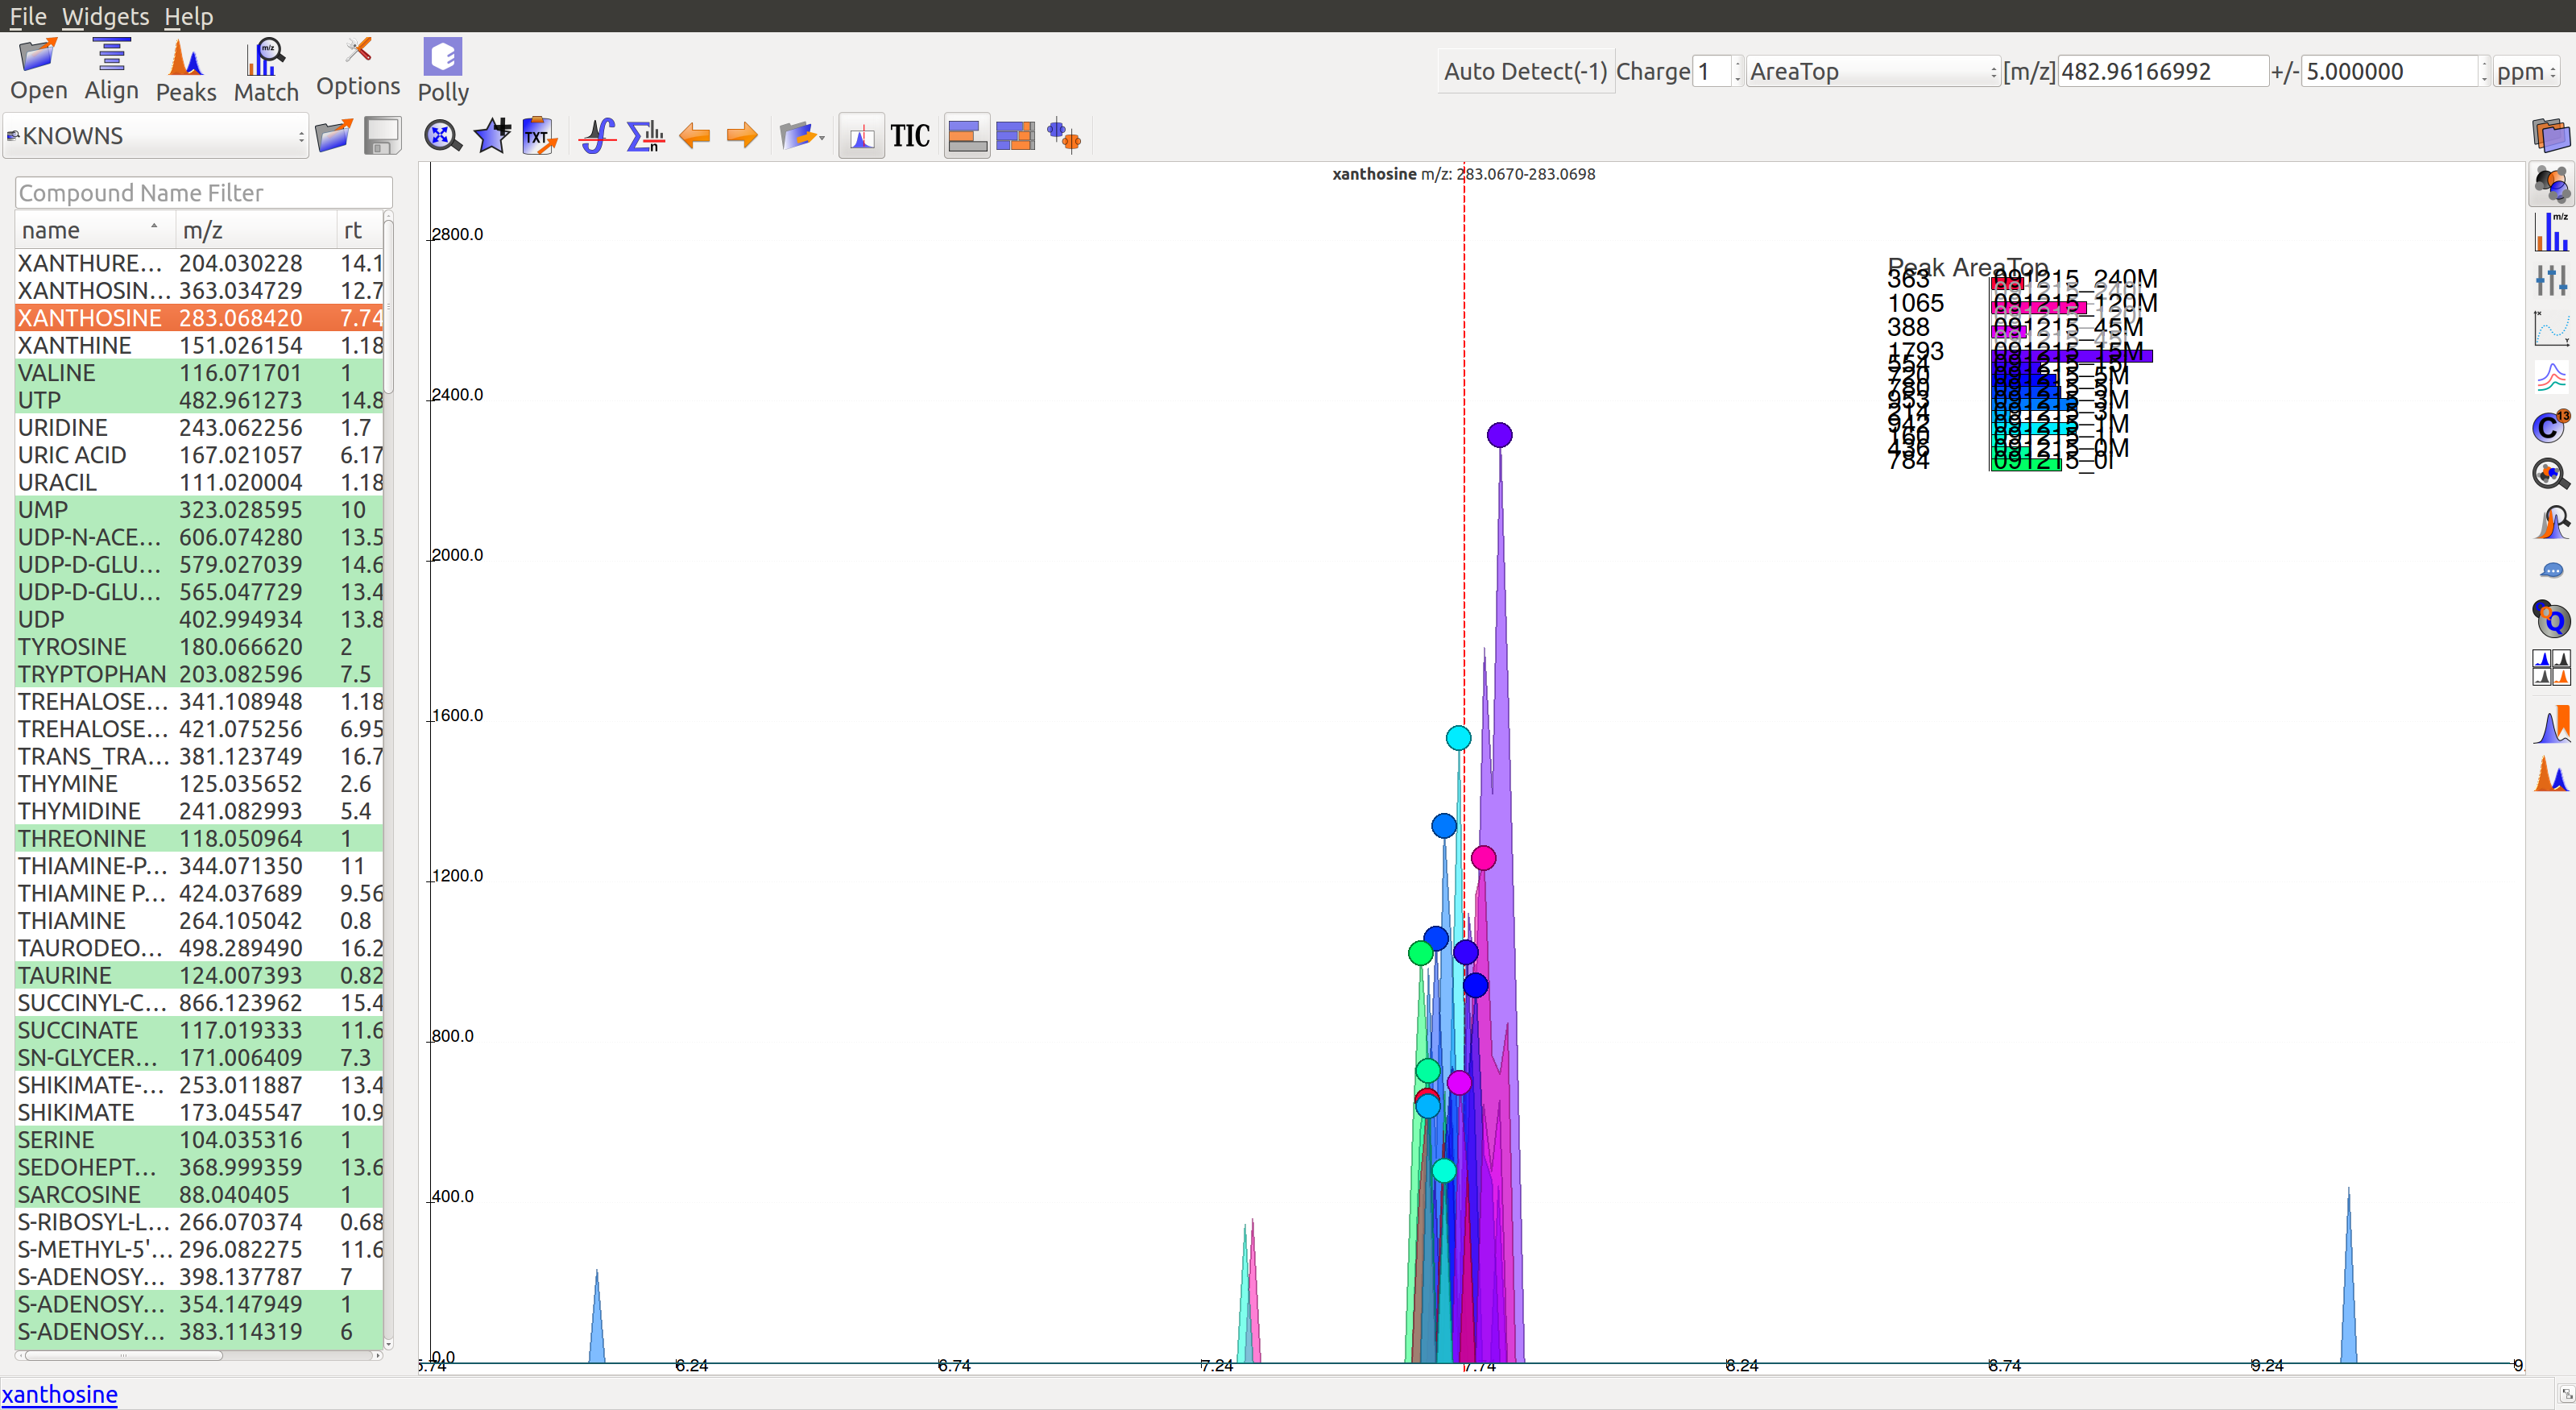
Once on a compound, El-MAVEN shows the highest ranked group for that m/z. Users can now choose a group or reject it. There are two ways to do this.
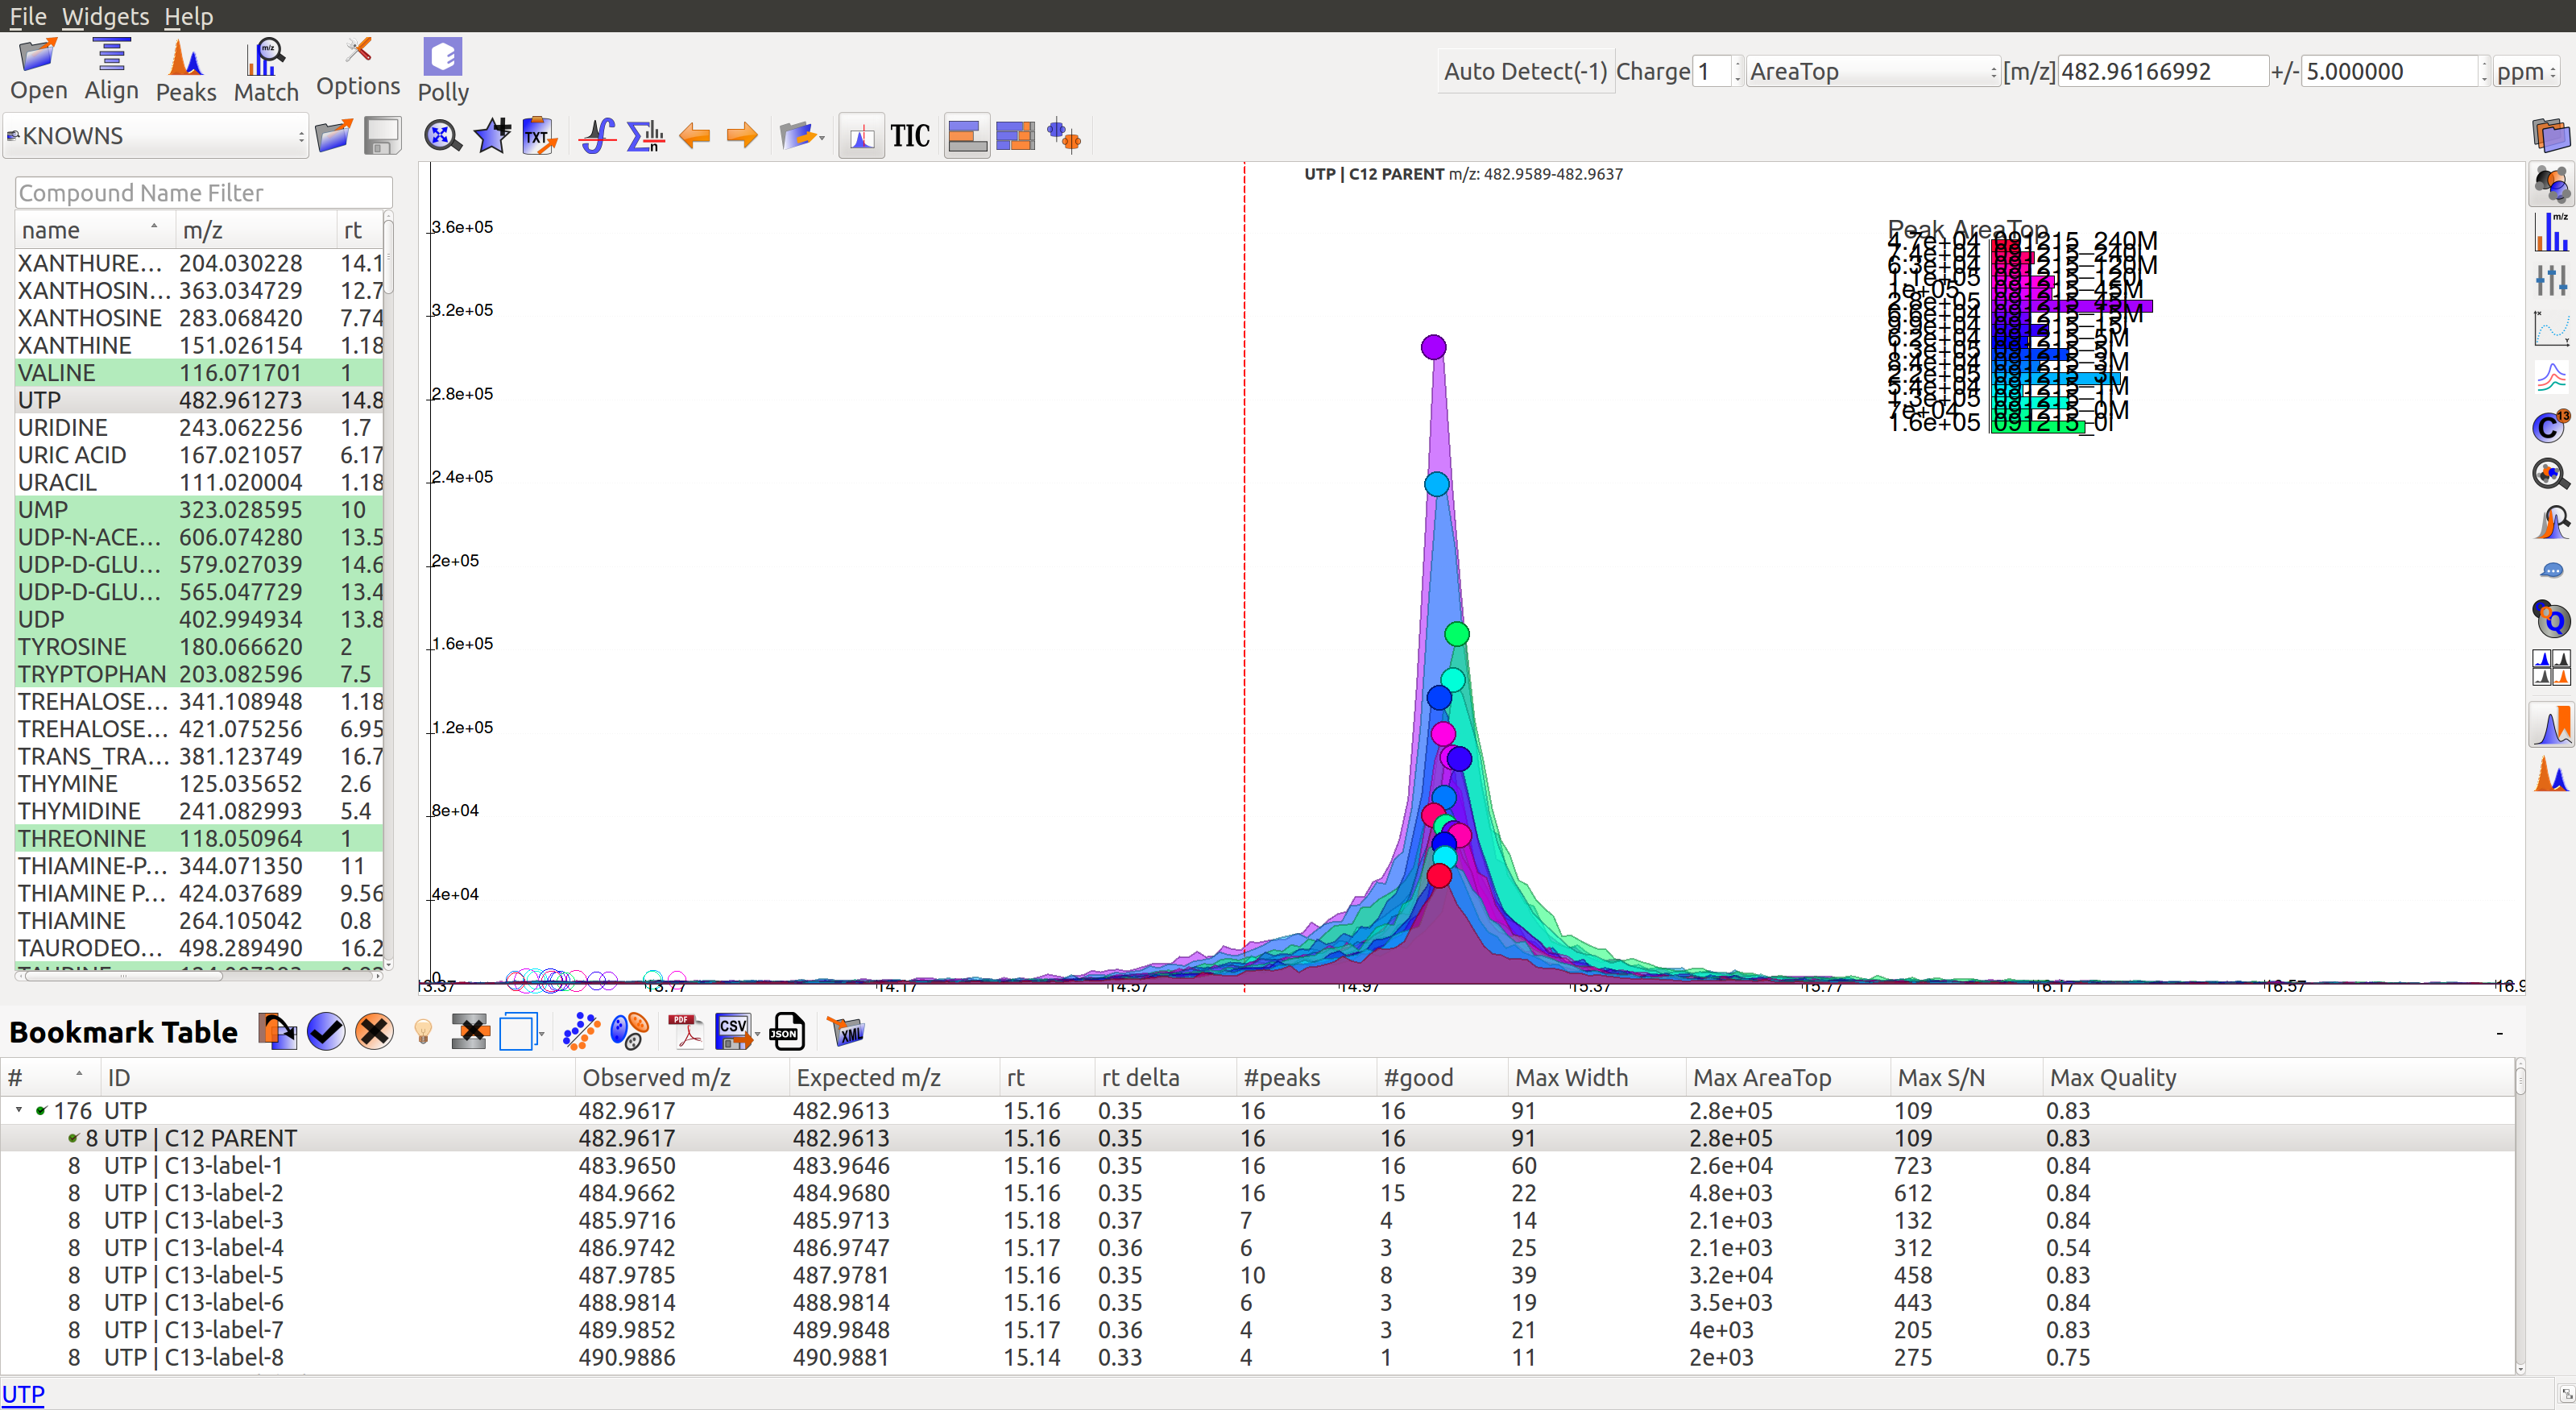
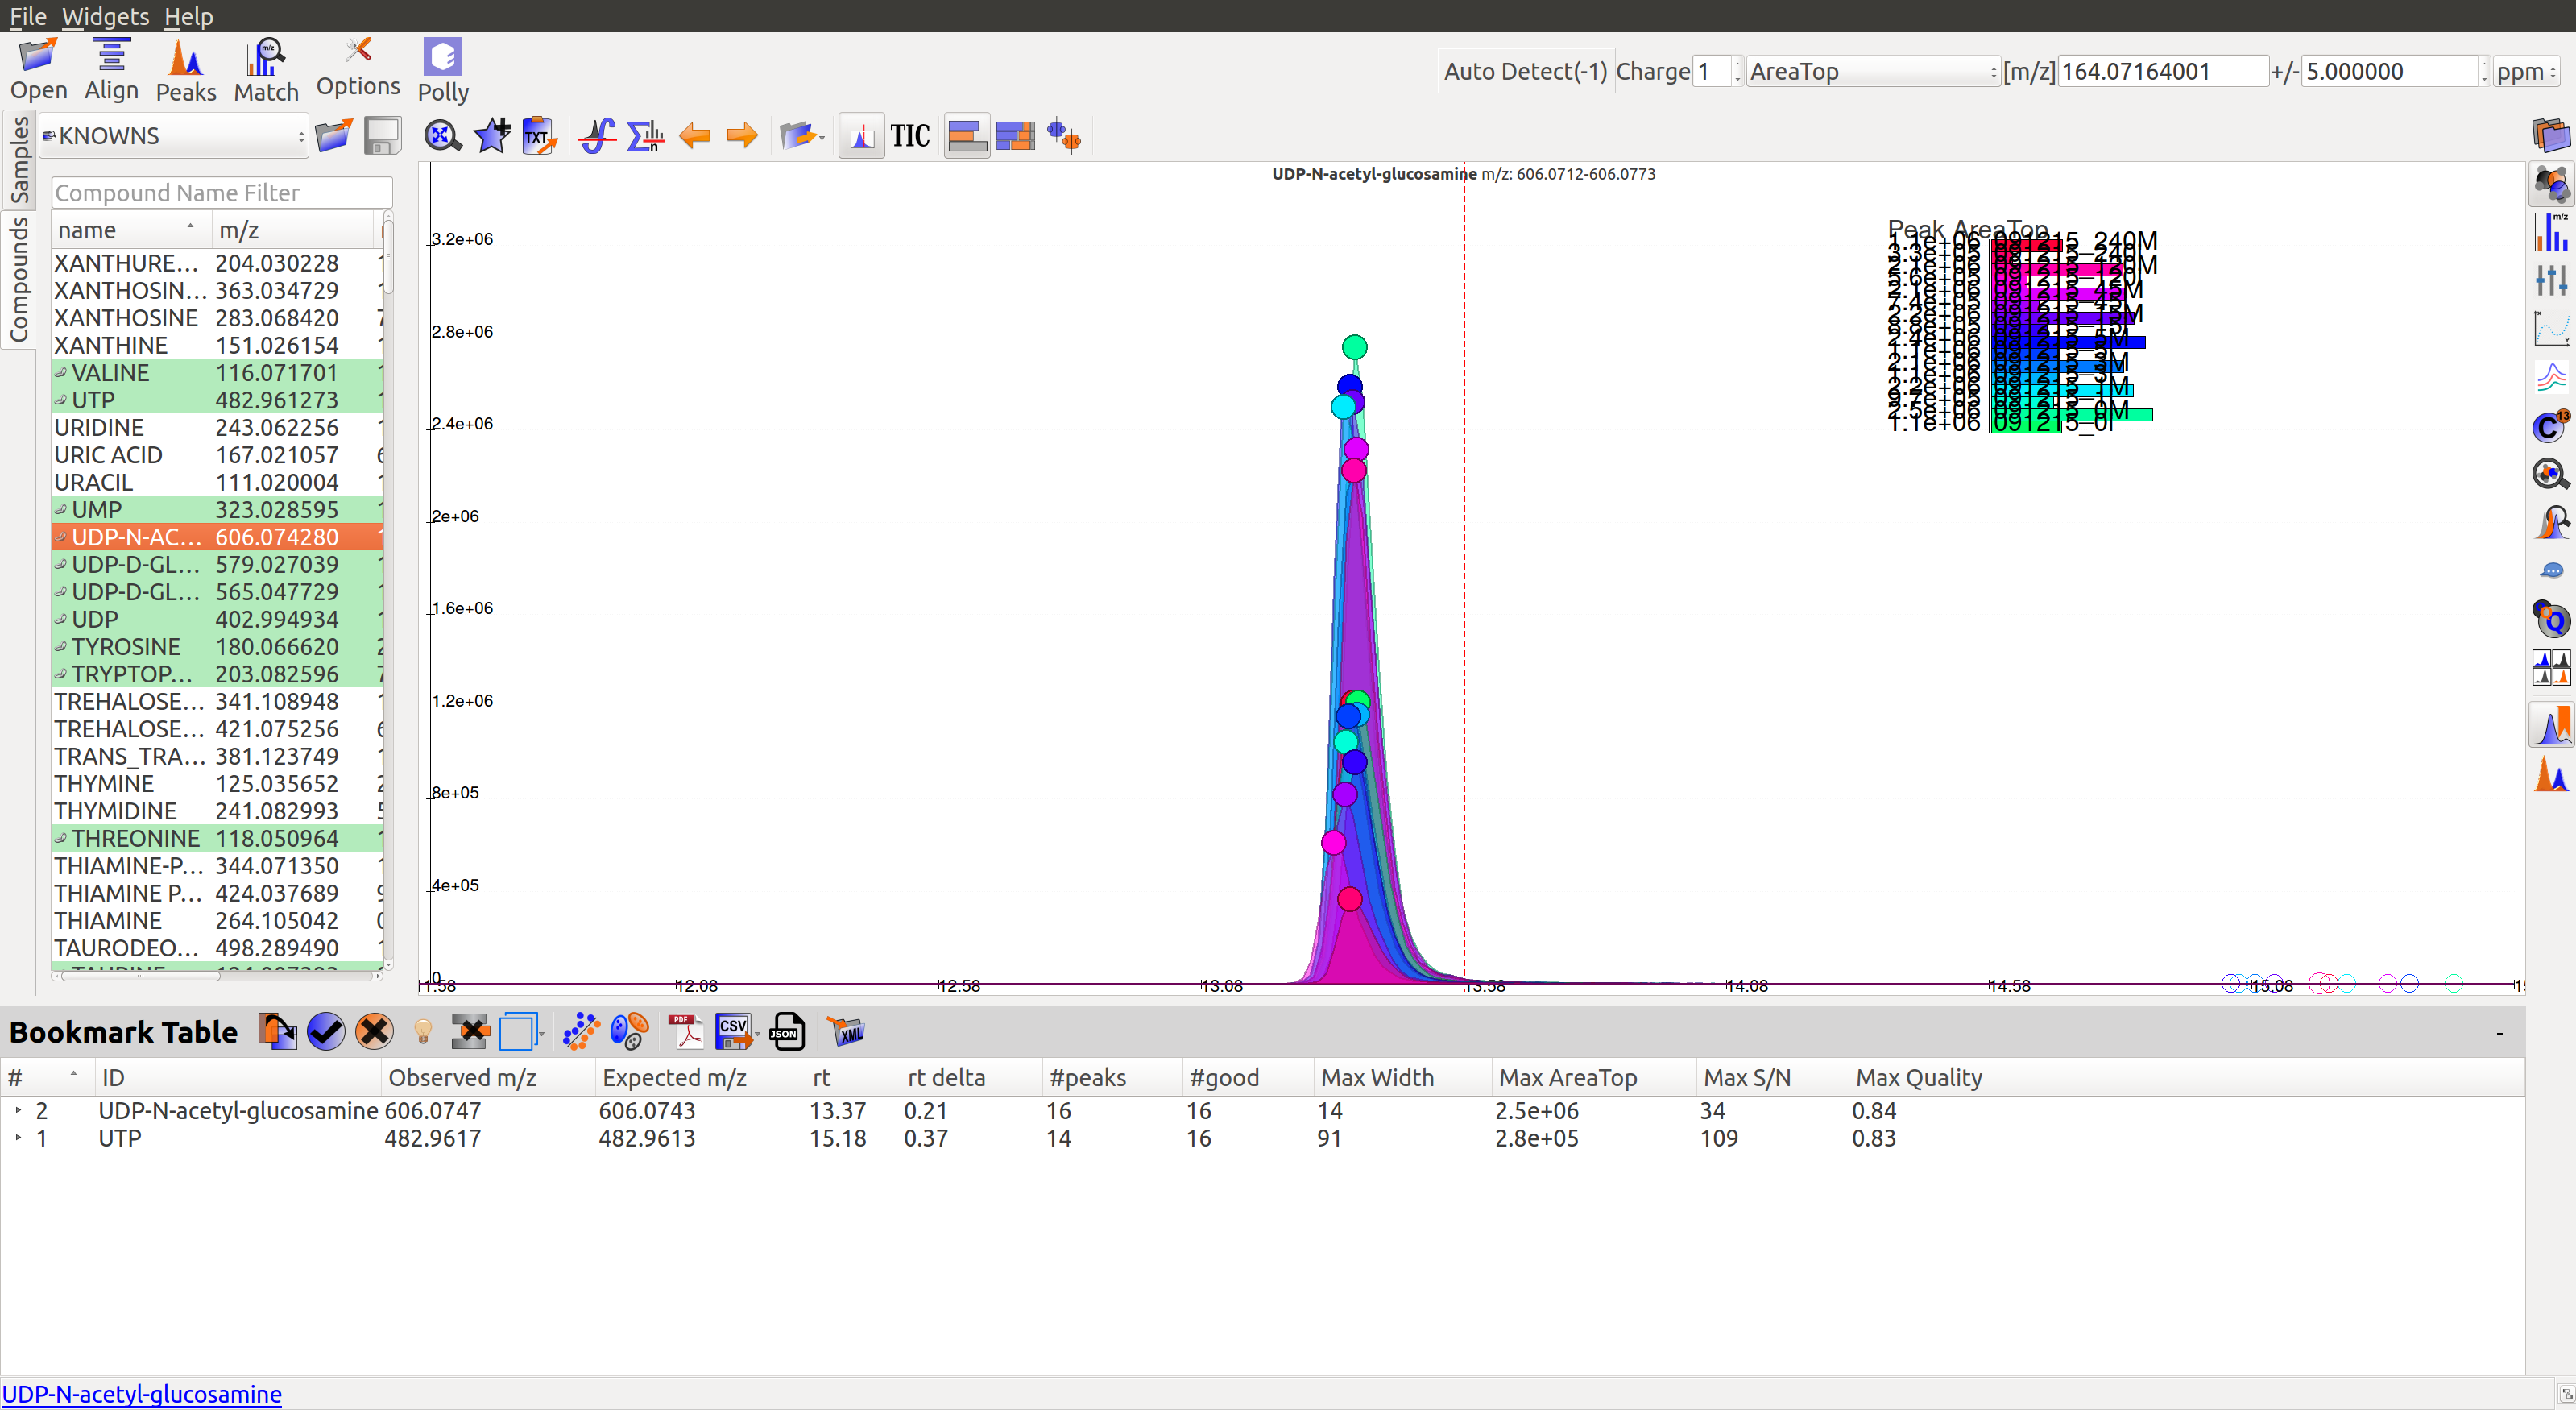
In the first workflow, users need to double click on the peak group of his choice. This will get the retention time line to the median of the group and also add the metabolite to the bookmarks table (as shown in the image below). Users can read more about the bookmarks table here.
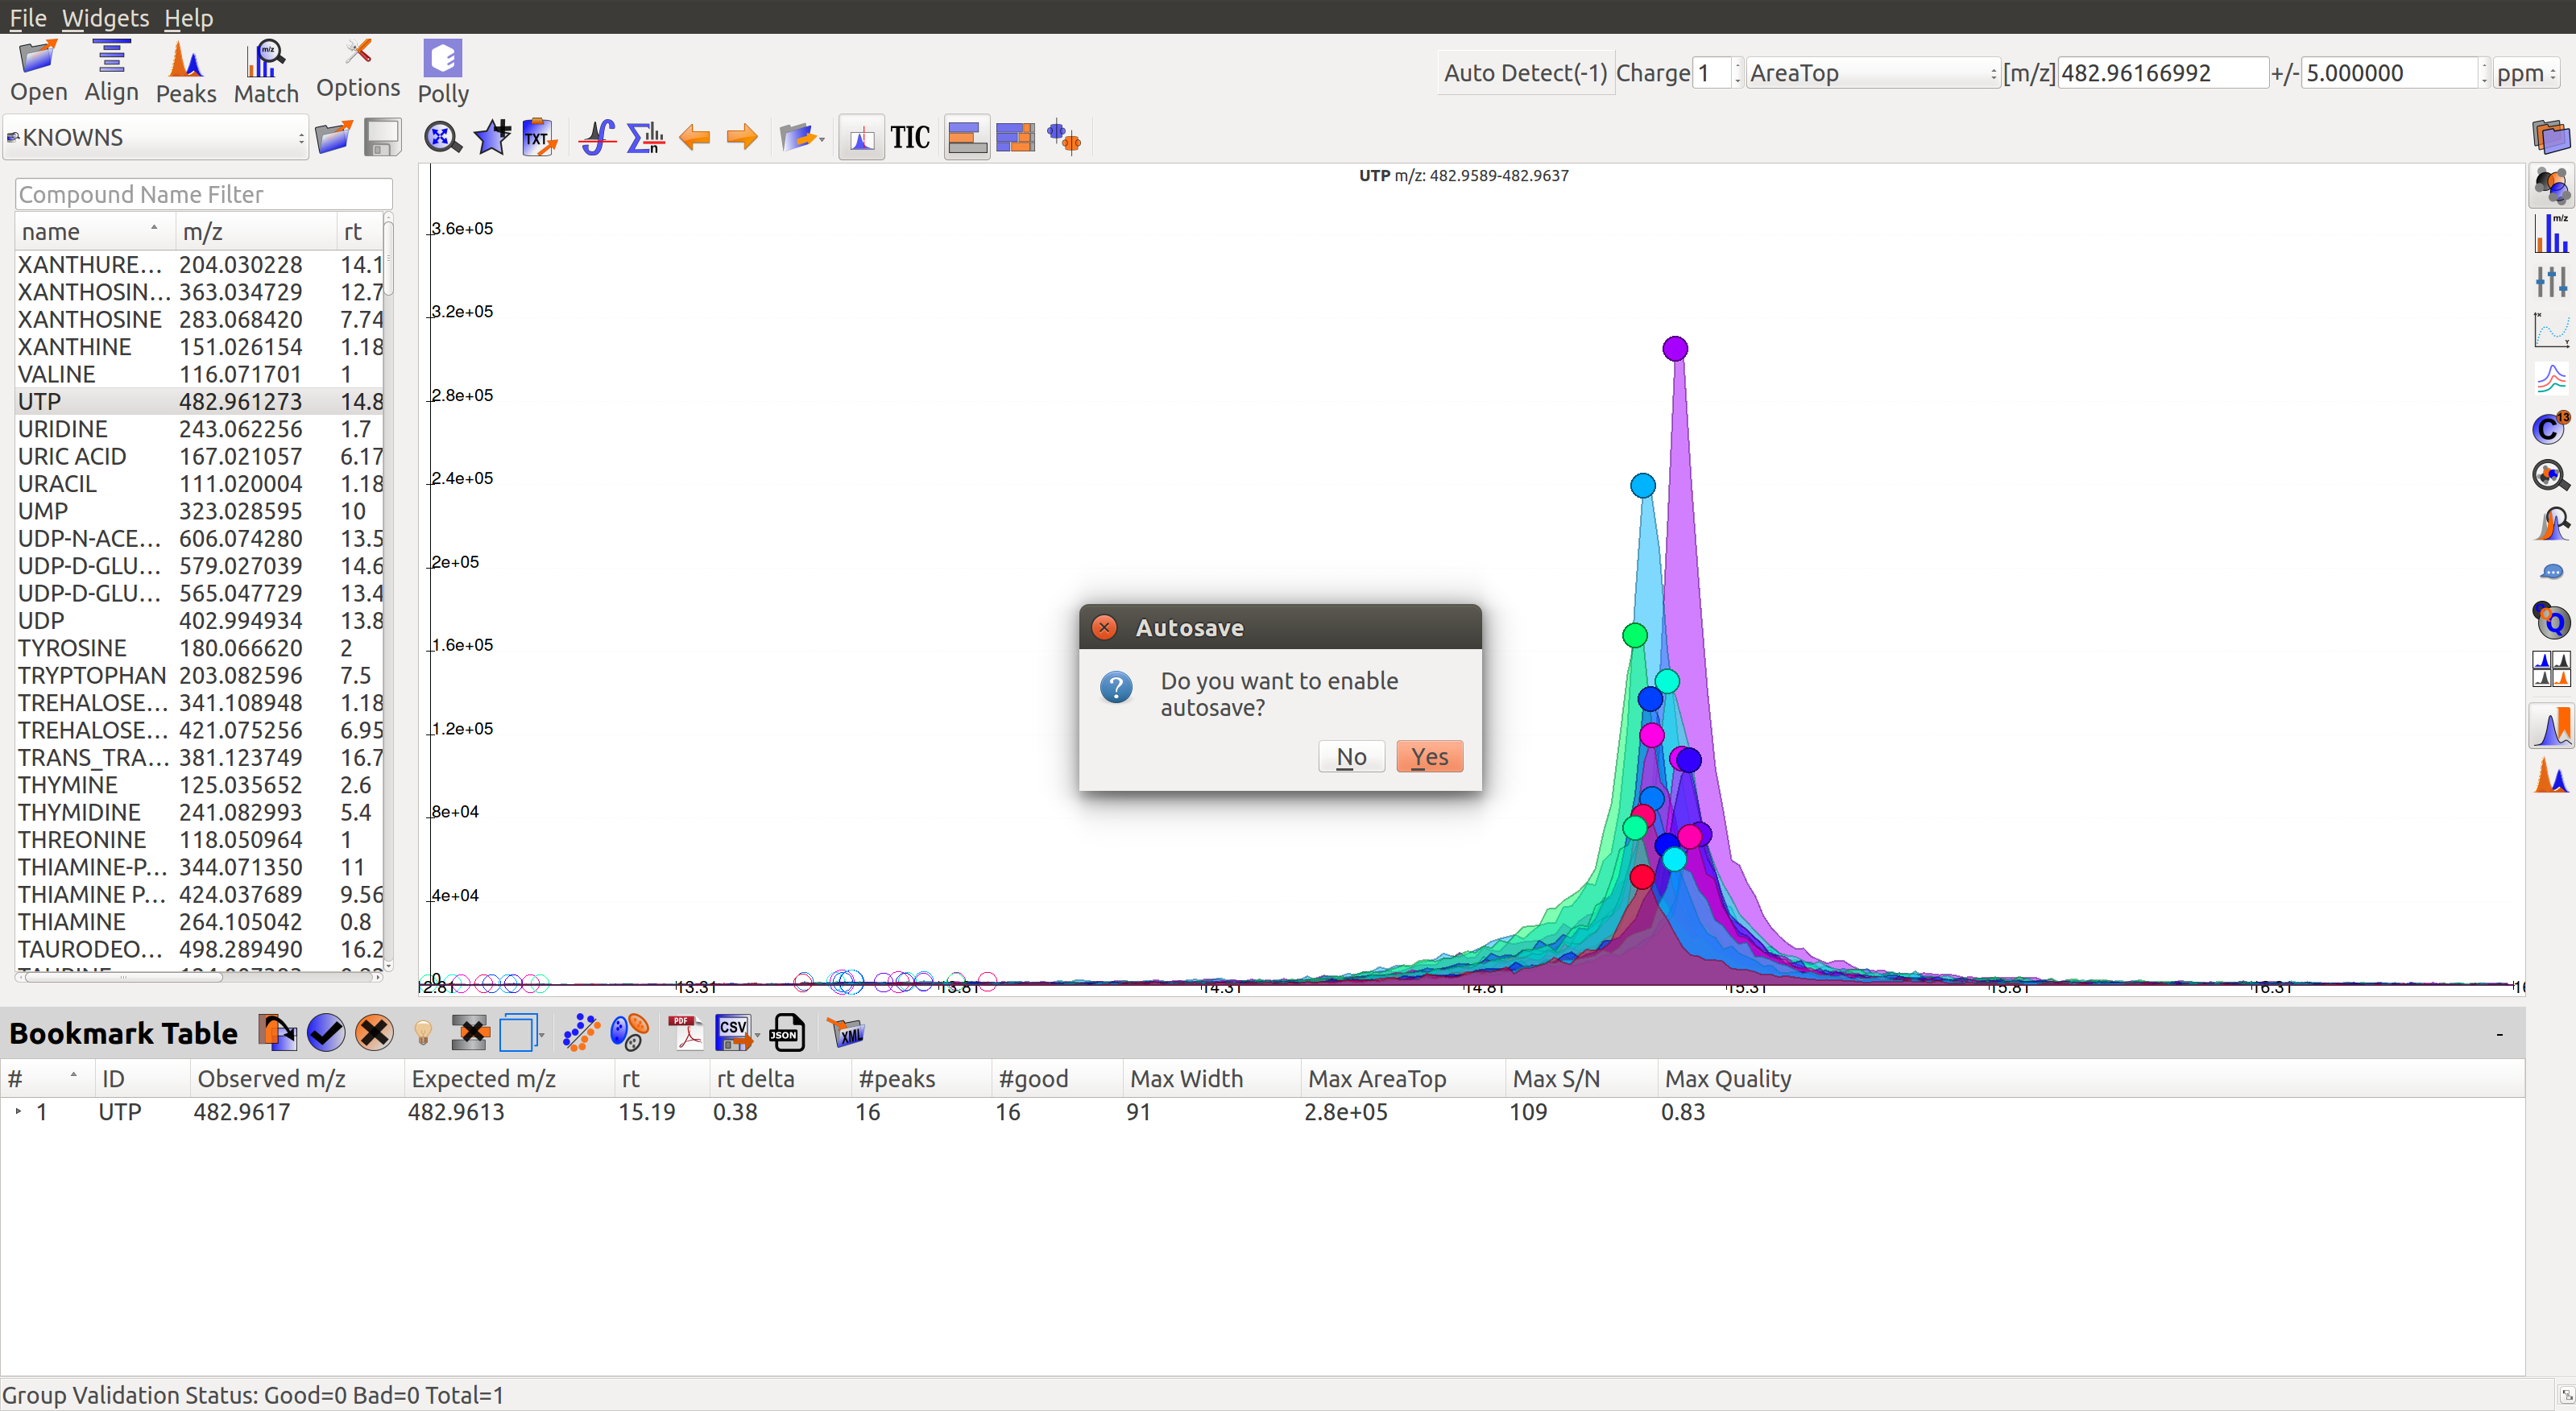
When the users select the first group they would be asked if they would like to auto-save the state of the application. This feature allows the users to go back to their curated peaks if they so wishes in future.
Users can then use dropdown arrow on bookmarked group to mark all its isotopologues as good or bad.
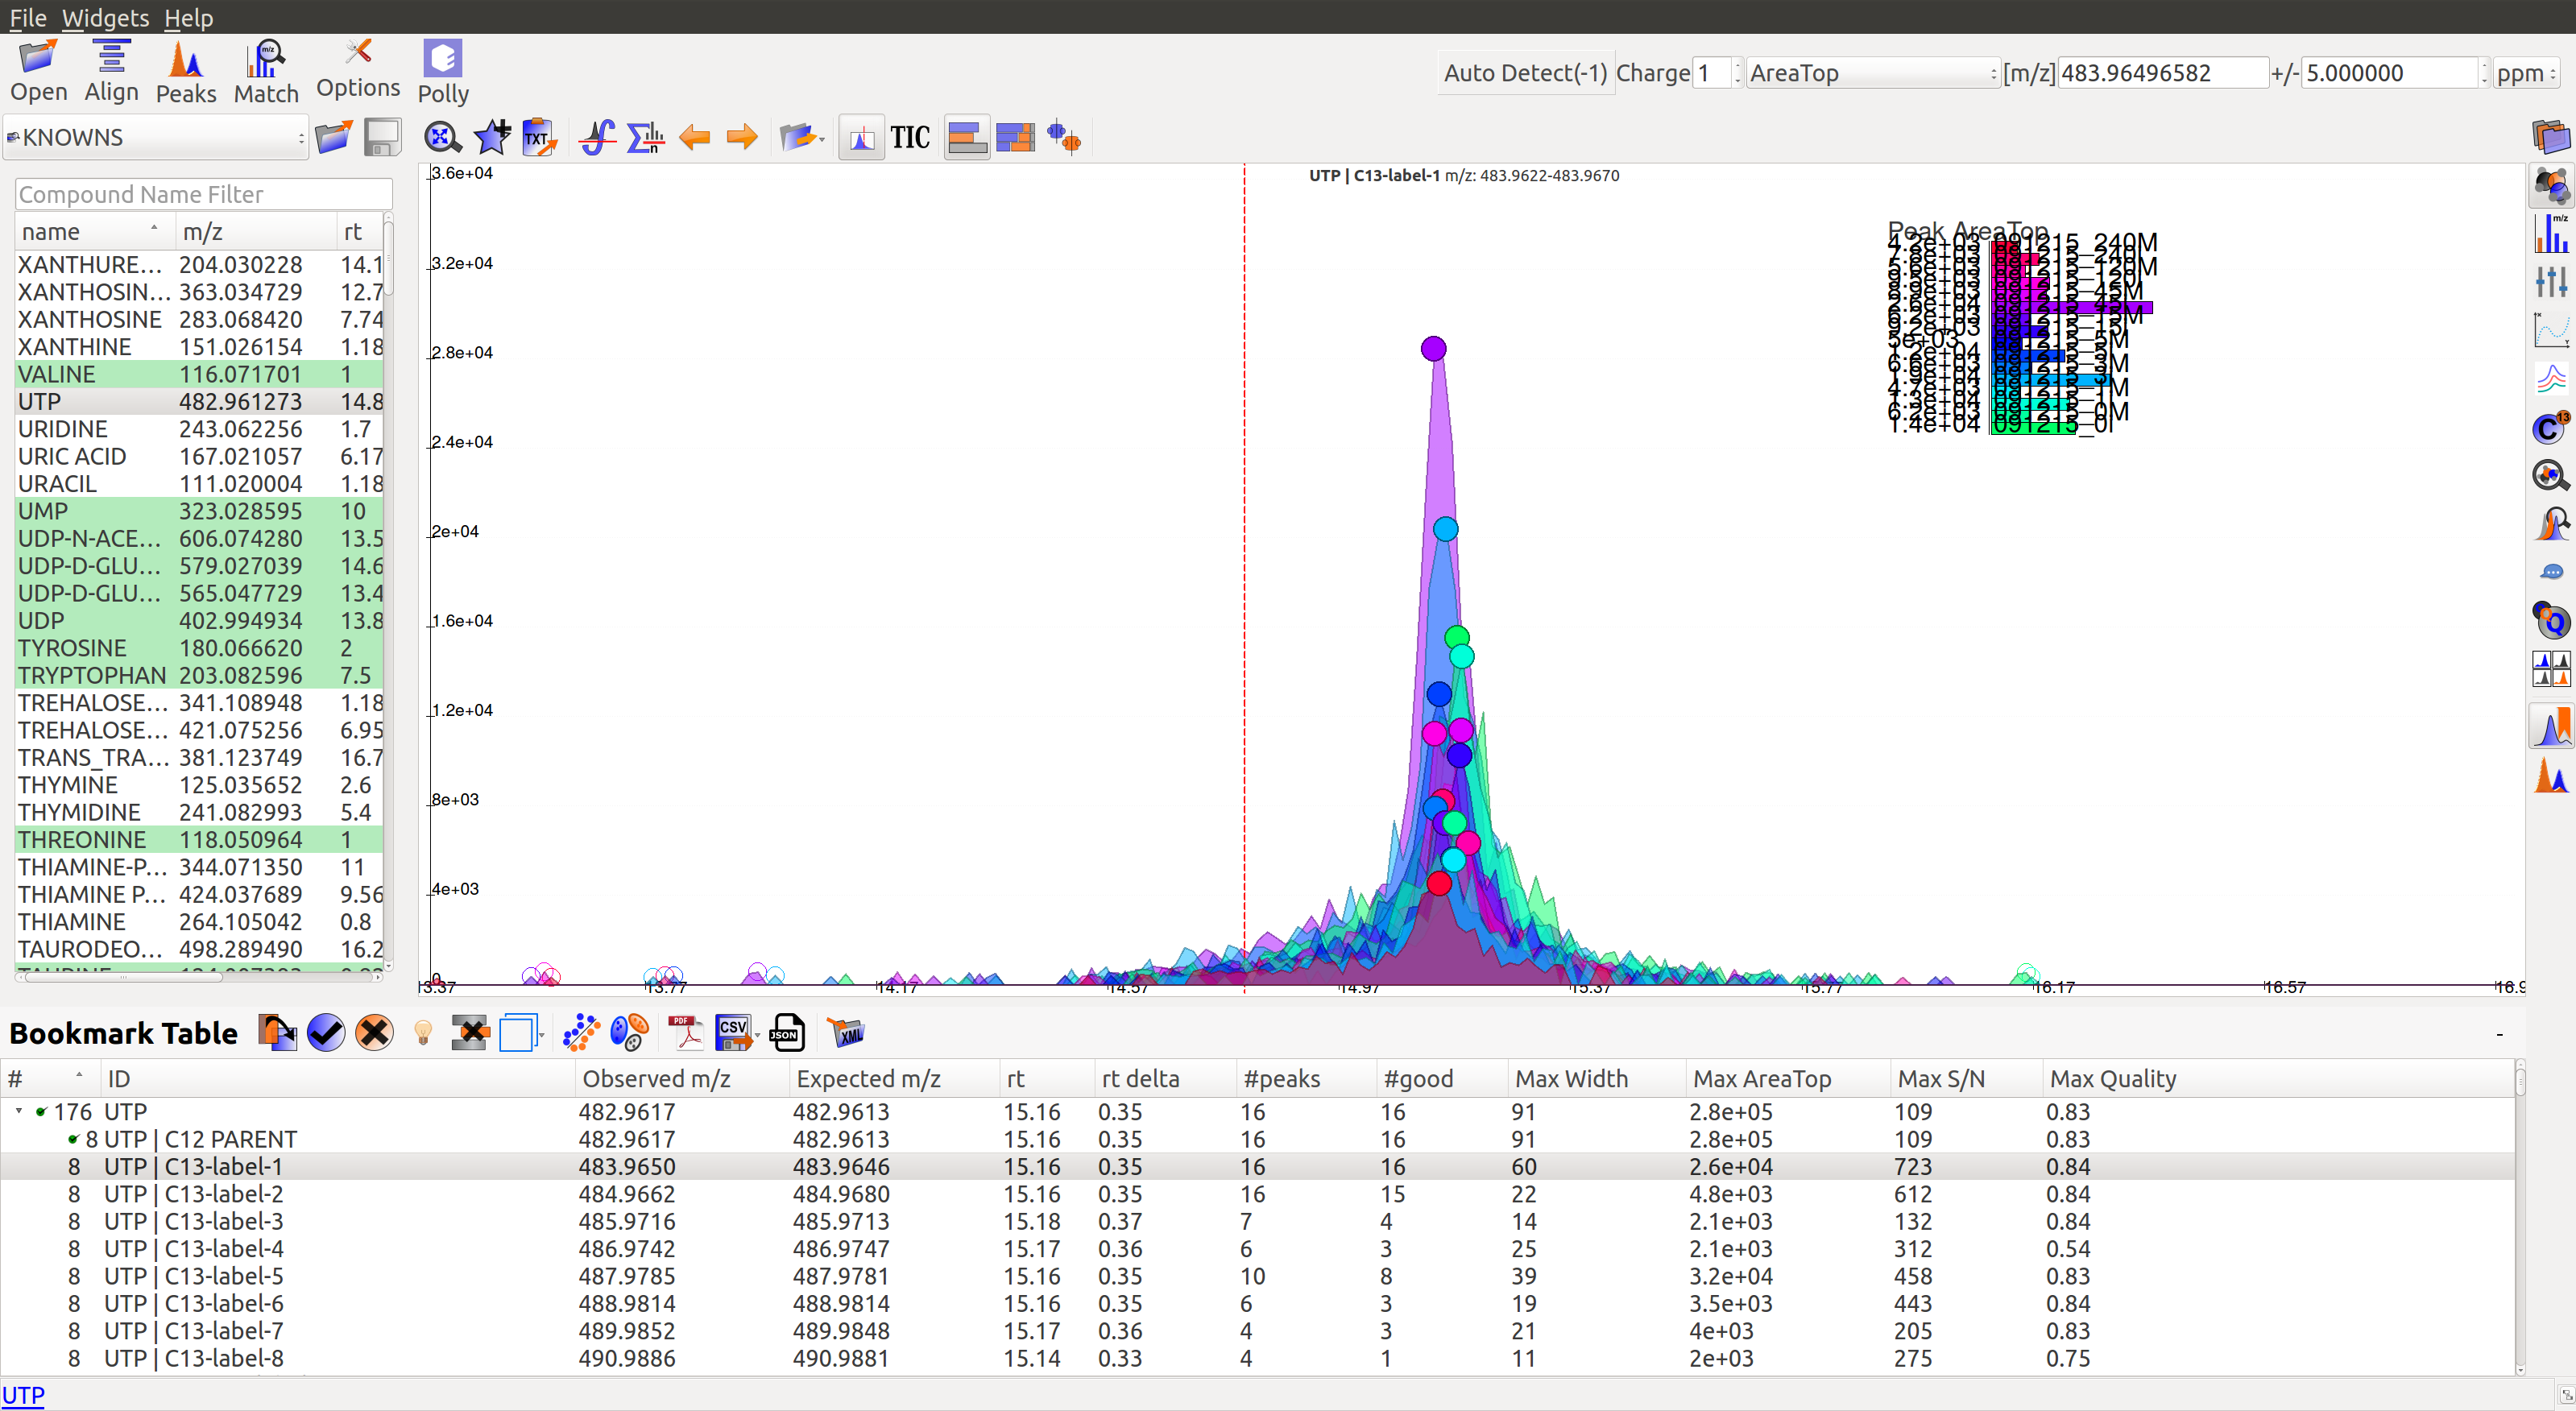
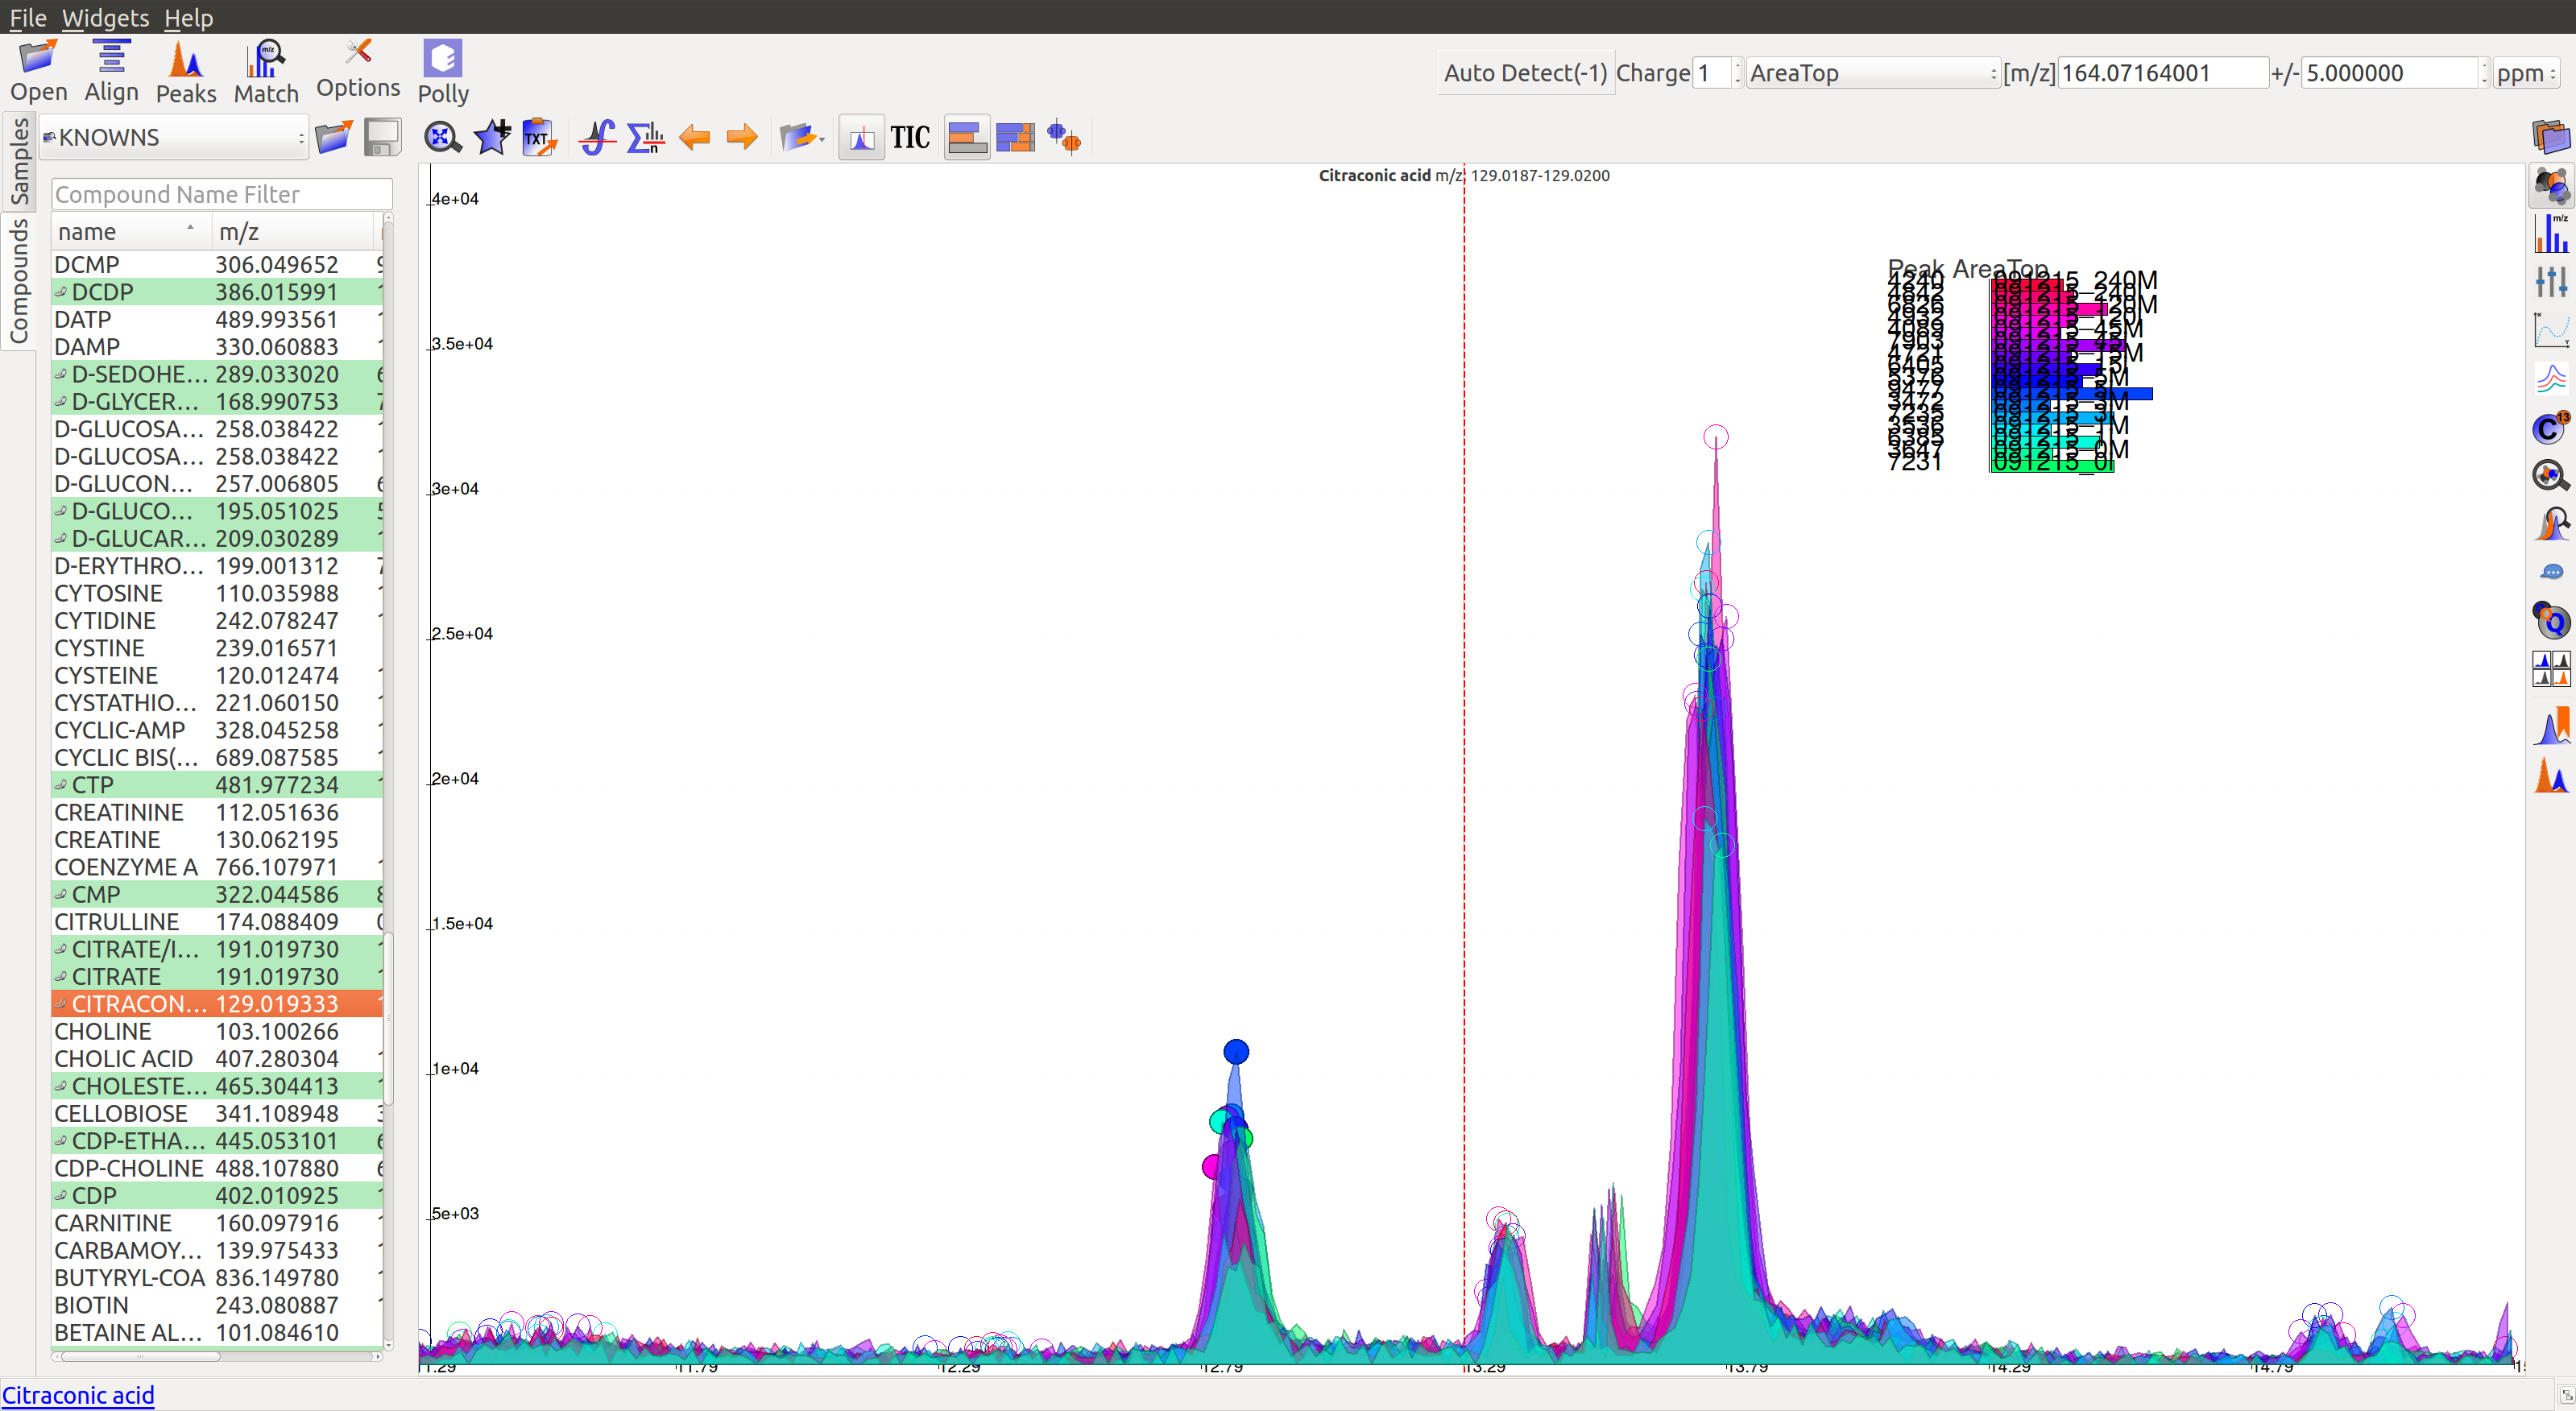
After marking all the groups for a compound, users can scroll down to the next compound and decide on the basis of shown EIC if the group should be marked for curation.
Double clicking on any peak (solid coloured circle) moves the retention time line along the group. And the group moves to the bookmark table.
Qualifying peaks as good or bad is explained in the next section.
Guidelines for Peak Picking
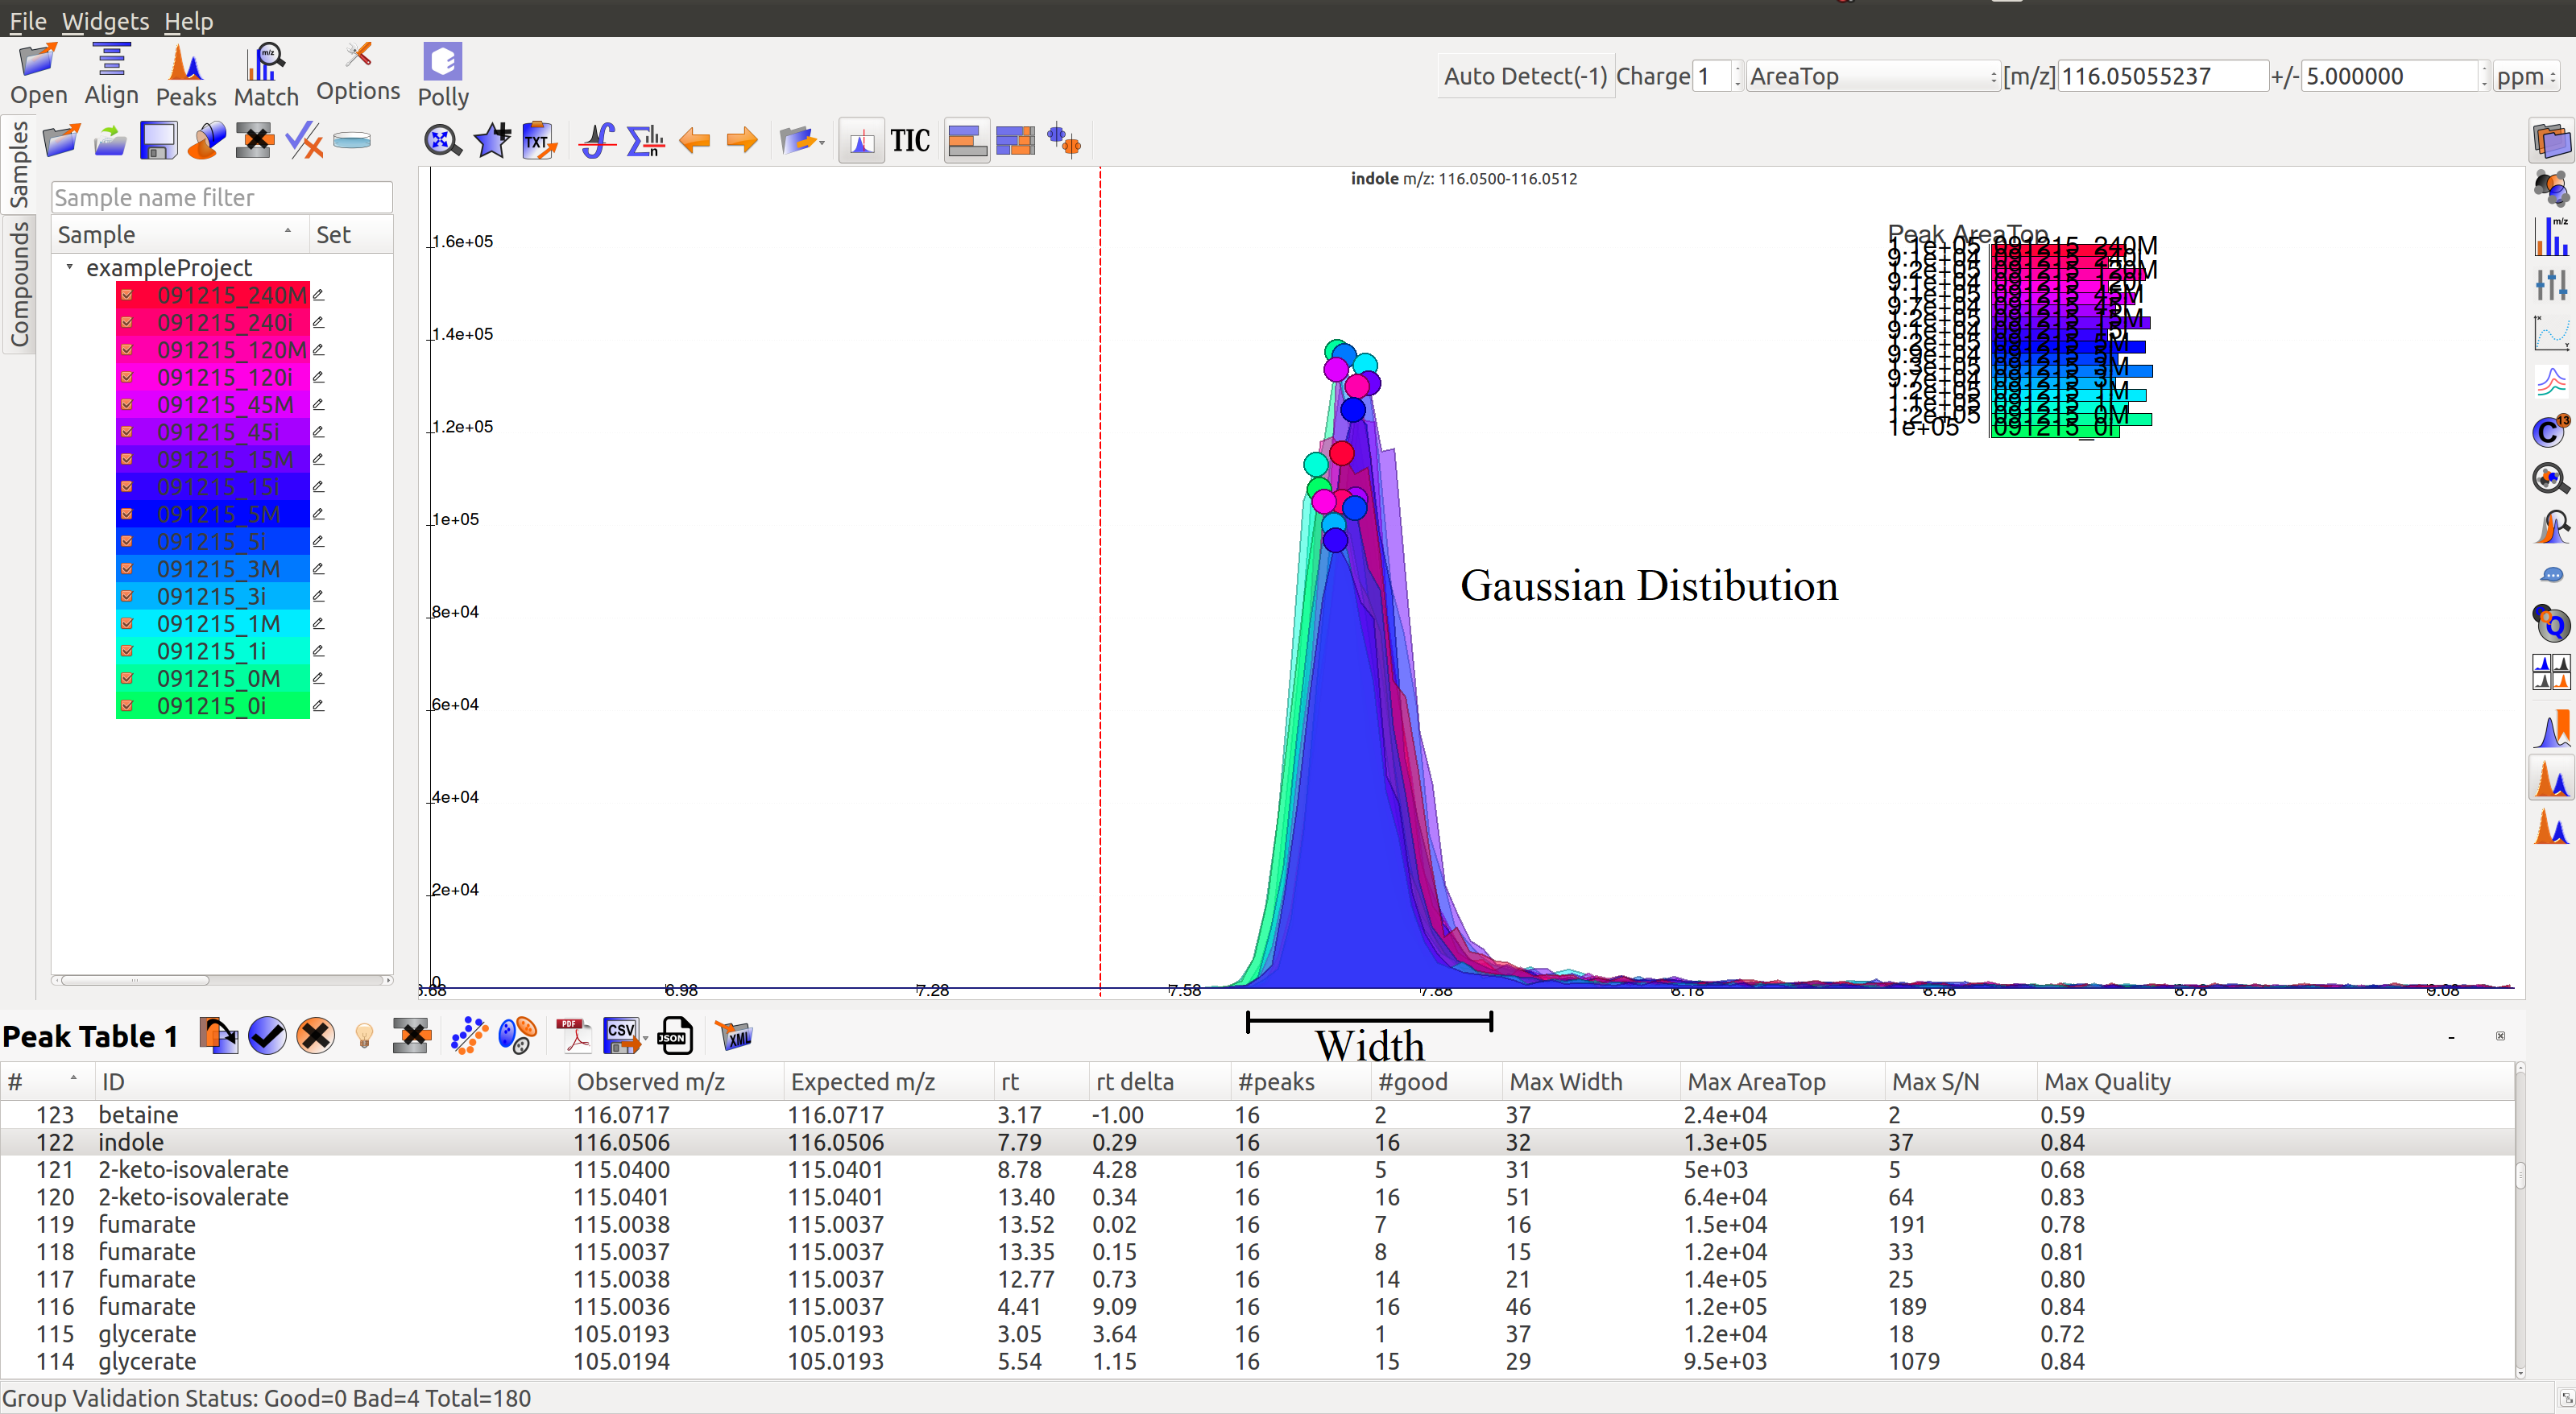
- A peak’s width and shape are two very crucial things to look at while classifying a peak as good or bad. The peak’s shape should have a Gaussian distribution and width should not be spread across a wide range of retention time.
- Peak Intensities for a group are plotted as bar plots for all the samples. These bar plots have heights relative to the other samples.Thus, for a good peak the intensities should be high.
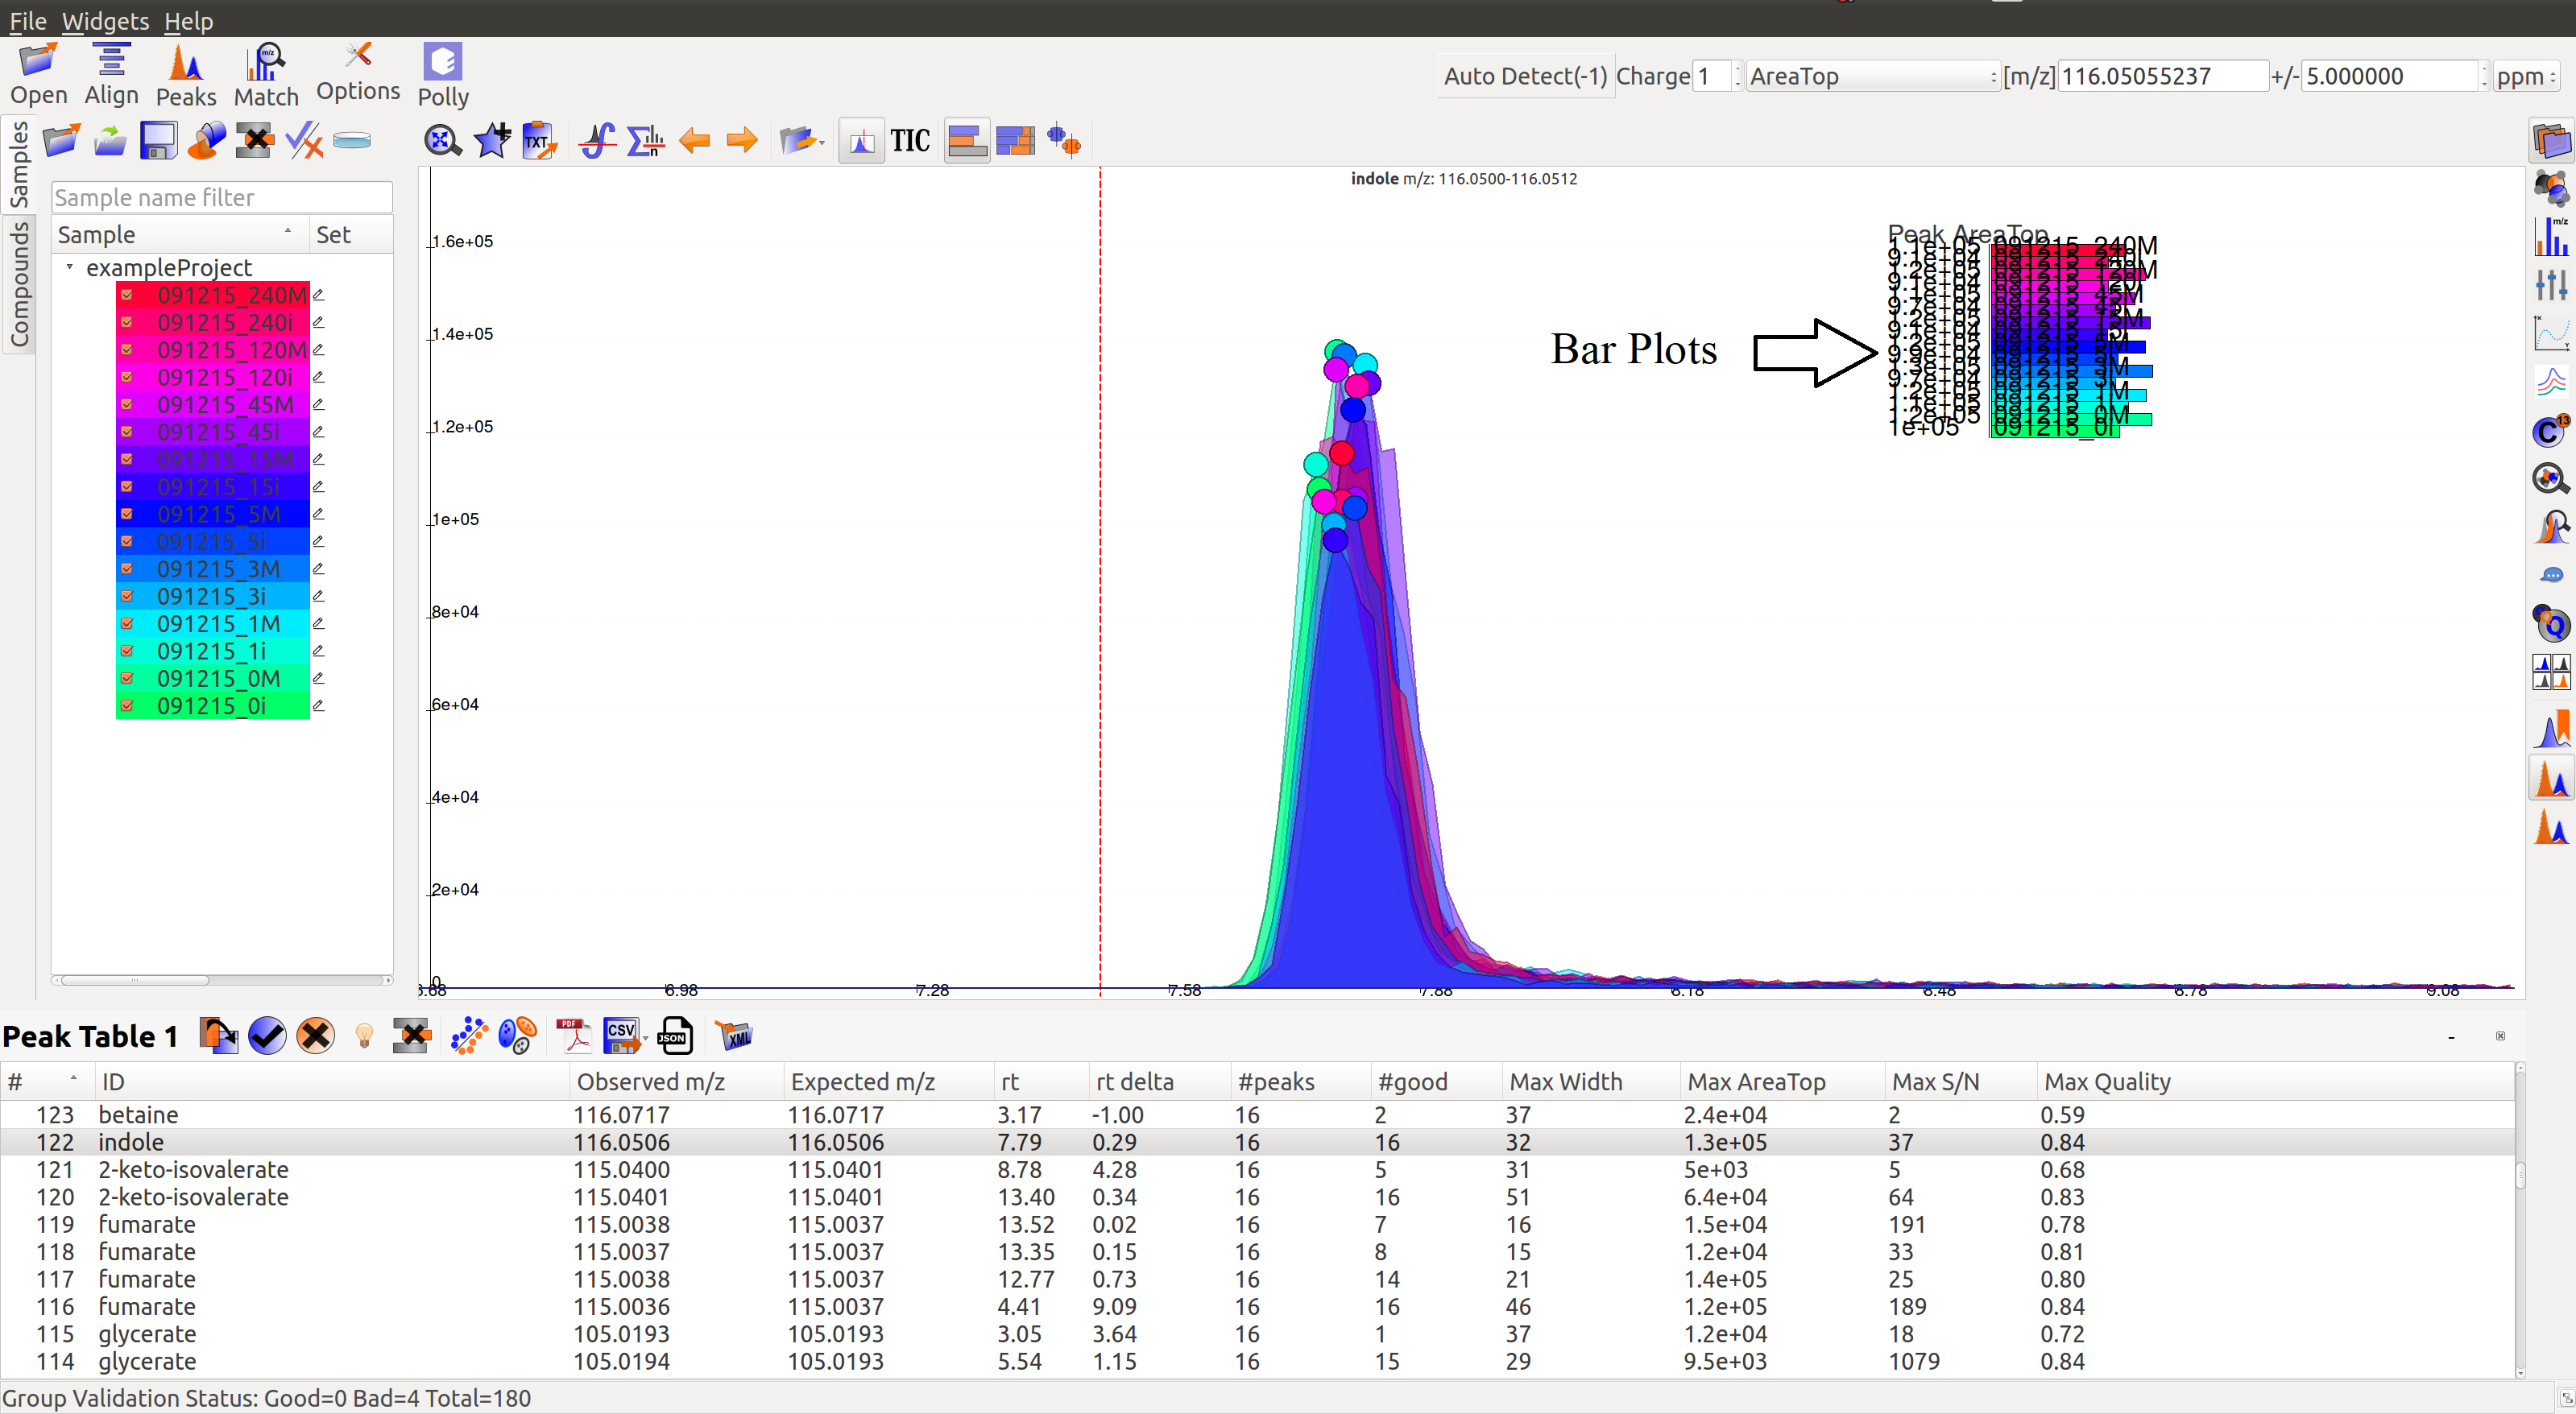
- Intensity Barplot heights should be higher for all the samples than Blank samples, as shown above. We use intensities of Blank samples to set our group baseline. Blank intensities are used to calibrate intensity values across zero concentration.
- A good peak should have standards with varying intensity in a particular fashion (increasing or decreasing).
- Quality Control (QC) samples give us information about the quality of the data, i.e., it assesses reproducibility and software performance. Samples whose intensities and concentrations are already known are used as QCs to determine if the instrument are working as expected. Values (and scales) can be calibrated using QCs.
- If peak groups of a particular metabolite are separated apart (not aligned well) then we should use stringent alignment parameters to overcome this problem.
- For a particular metabolite, let’s say if it has n number of groups, then the group which is much closer to the above guidelines should be selected as good peak. Multiple groups can also be selected in case of ambiguity (if retention time information is not provided).
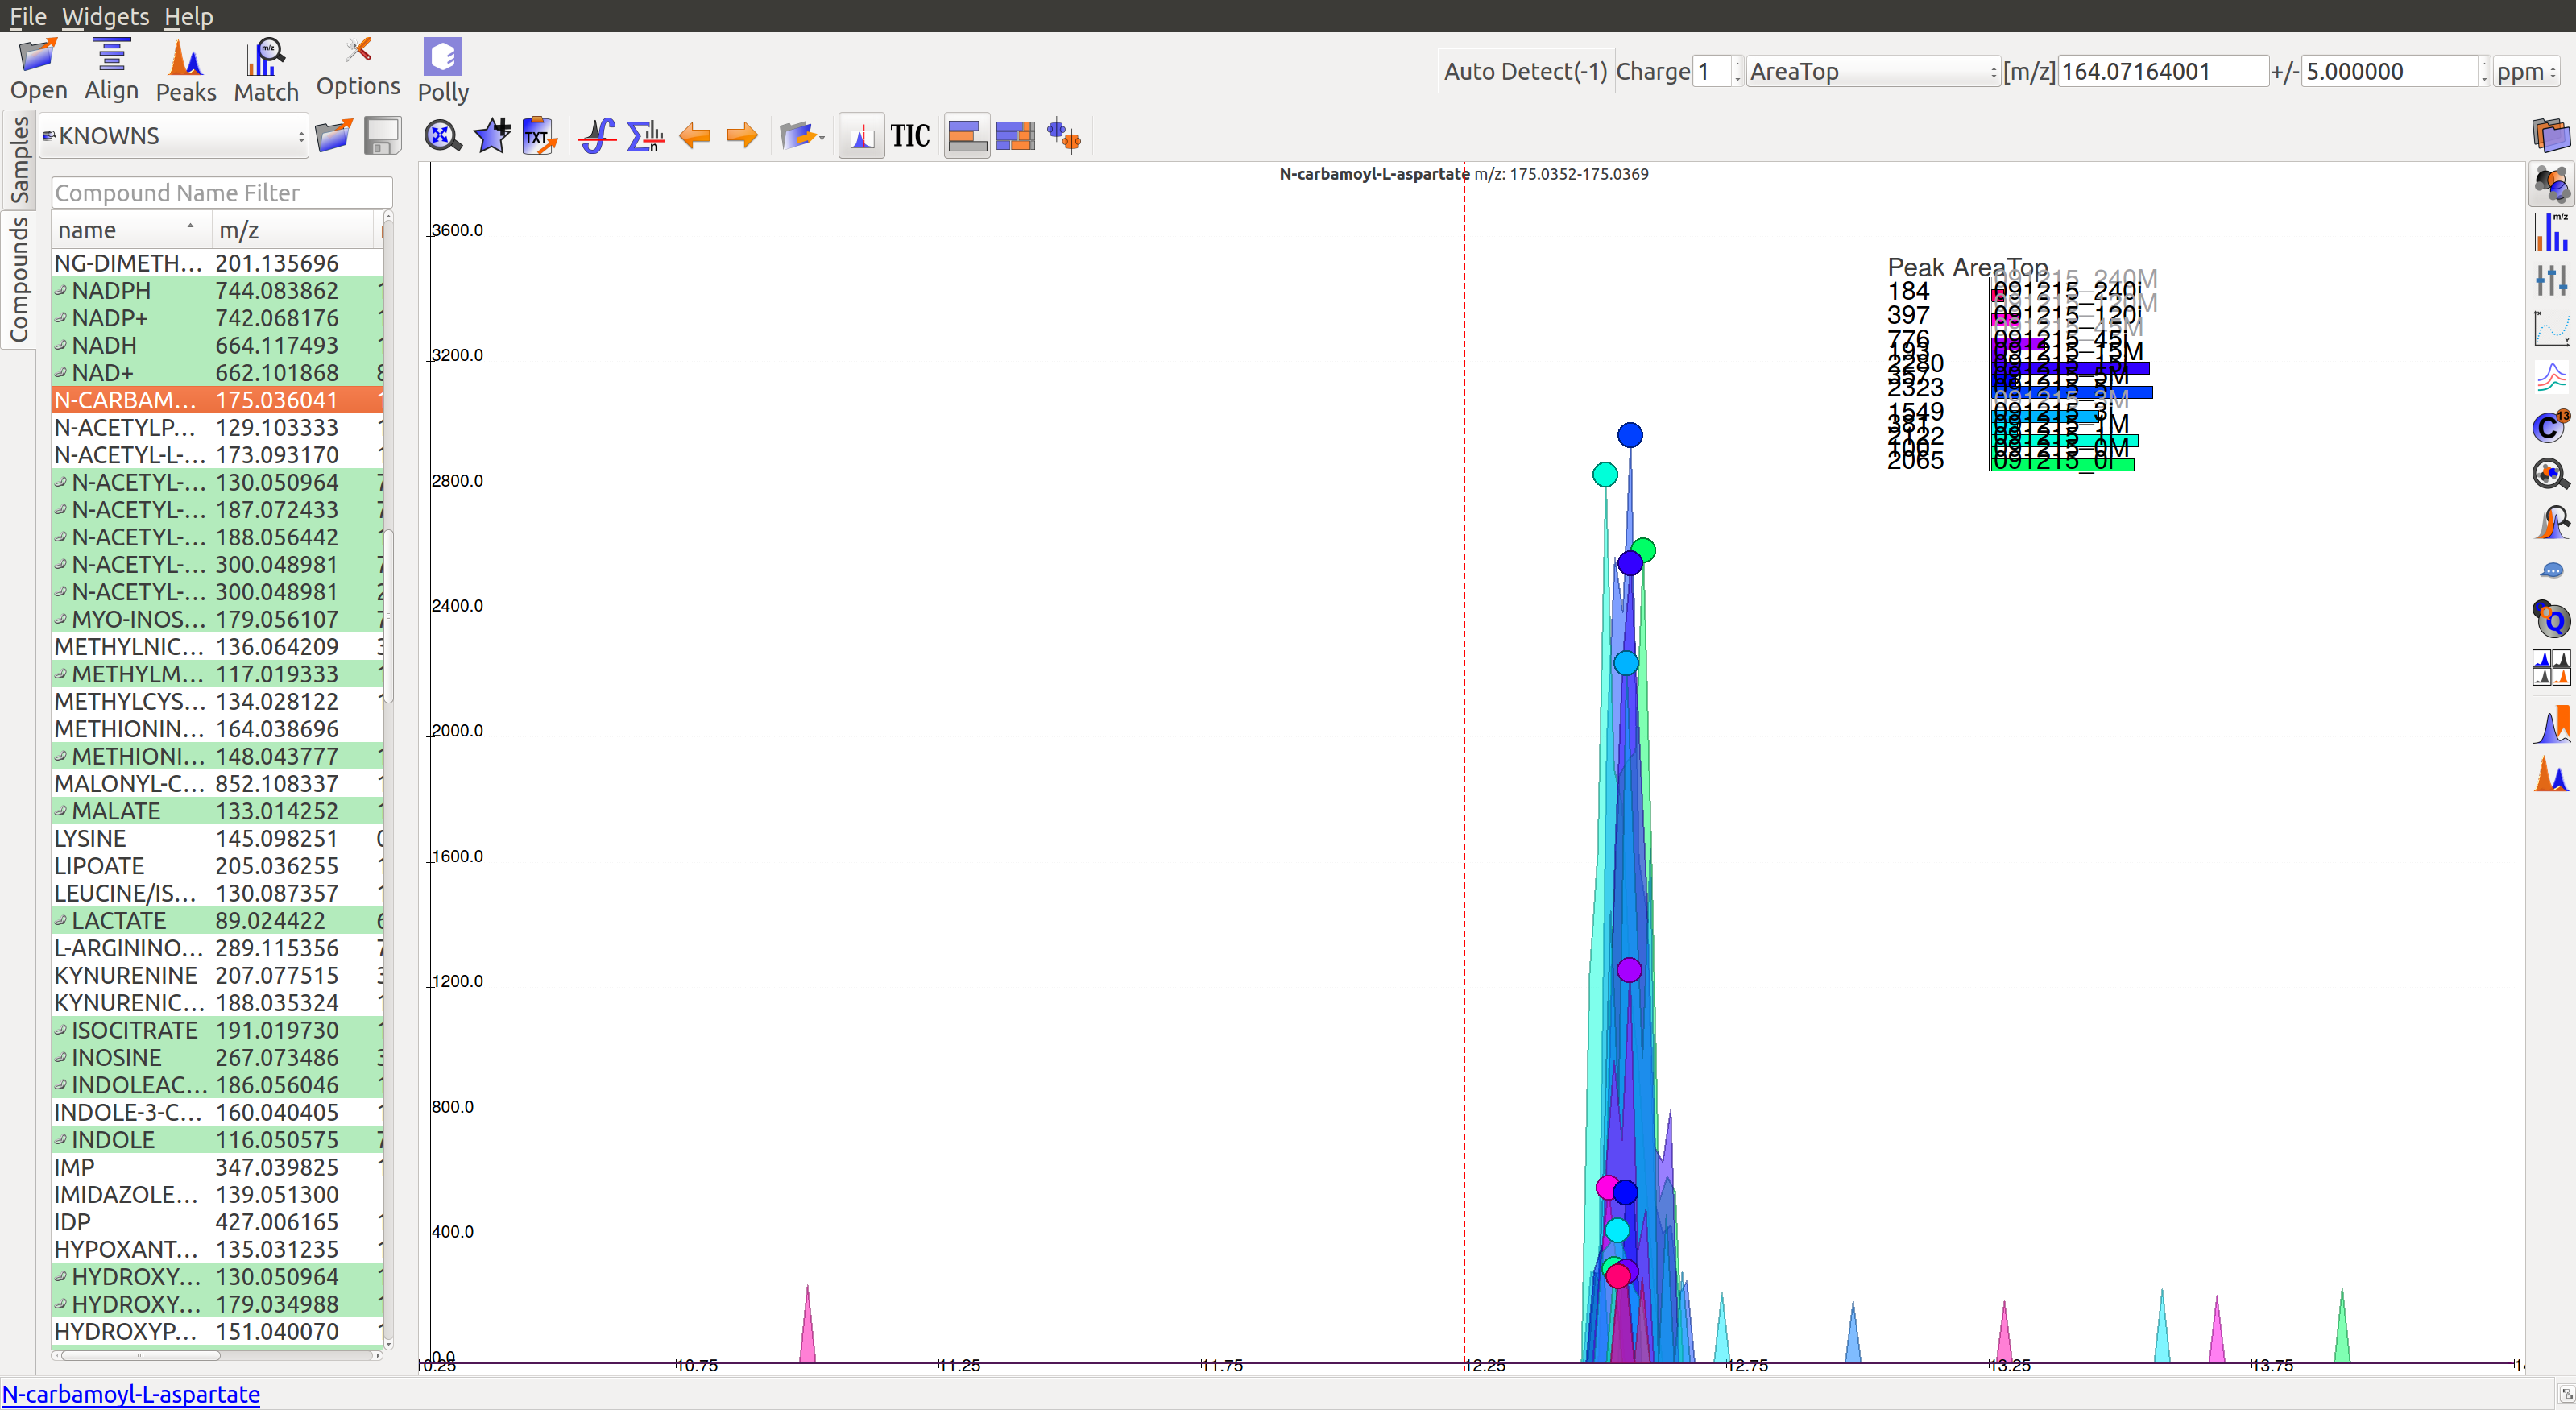
A good peak would look similar to the following peaks:
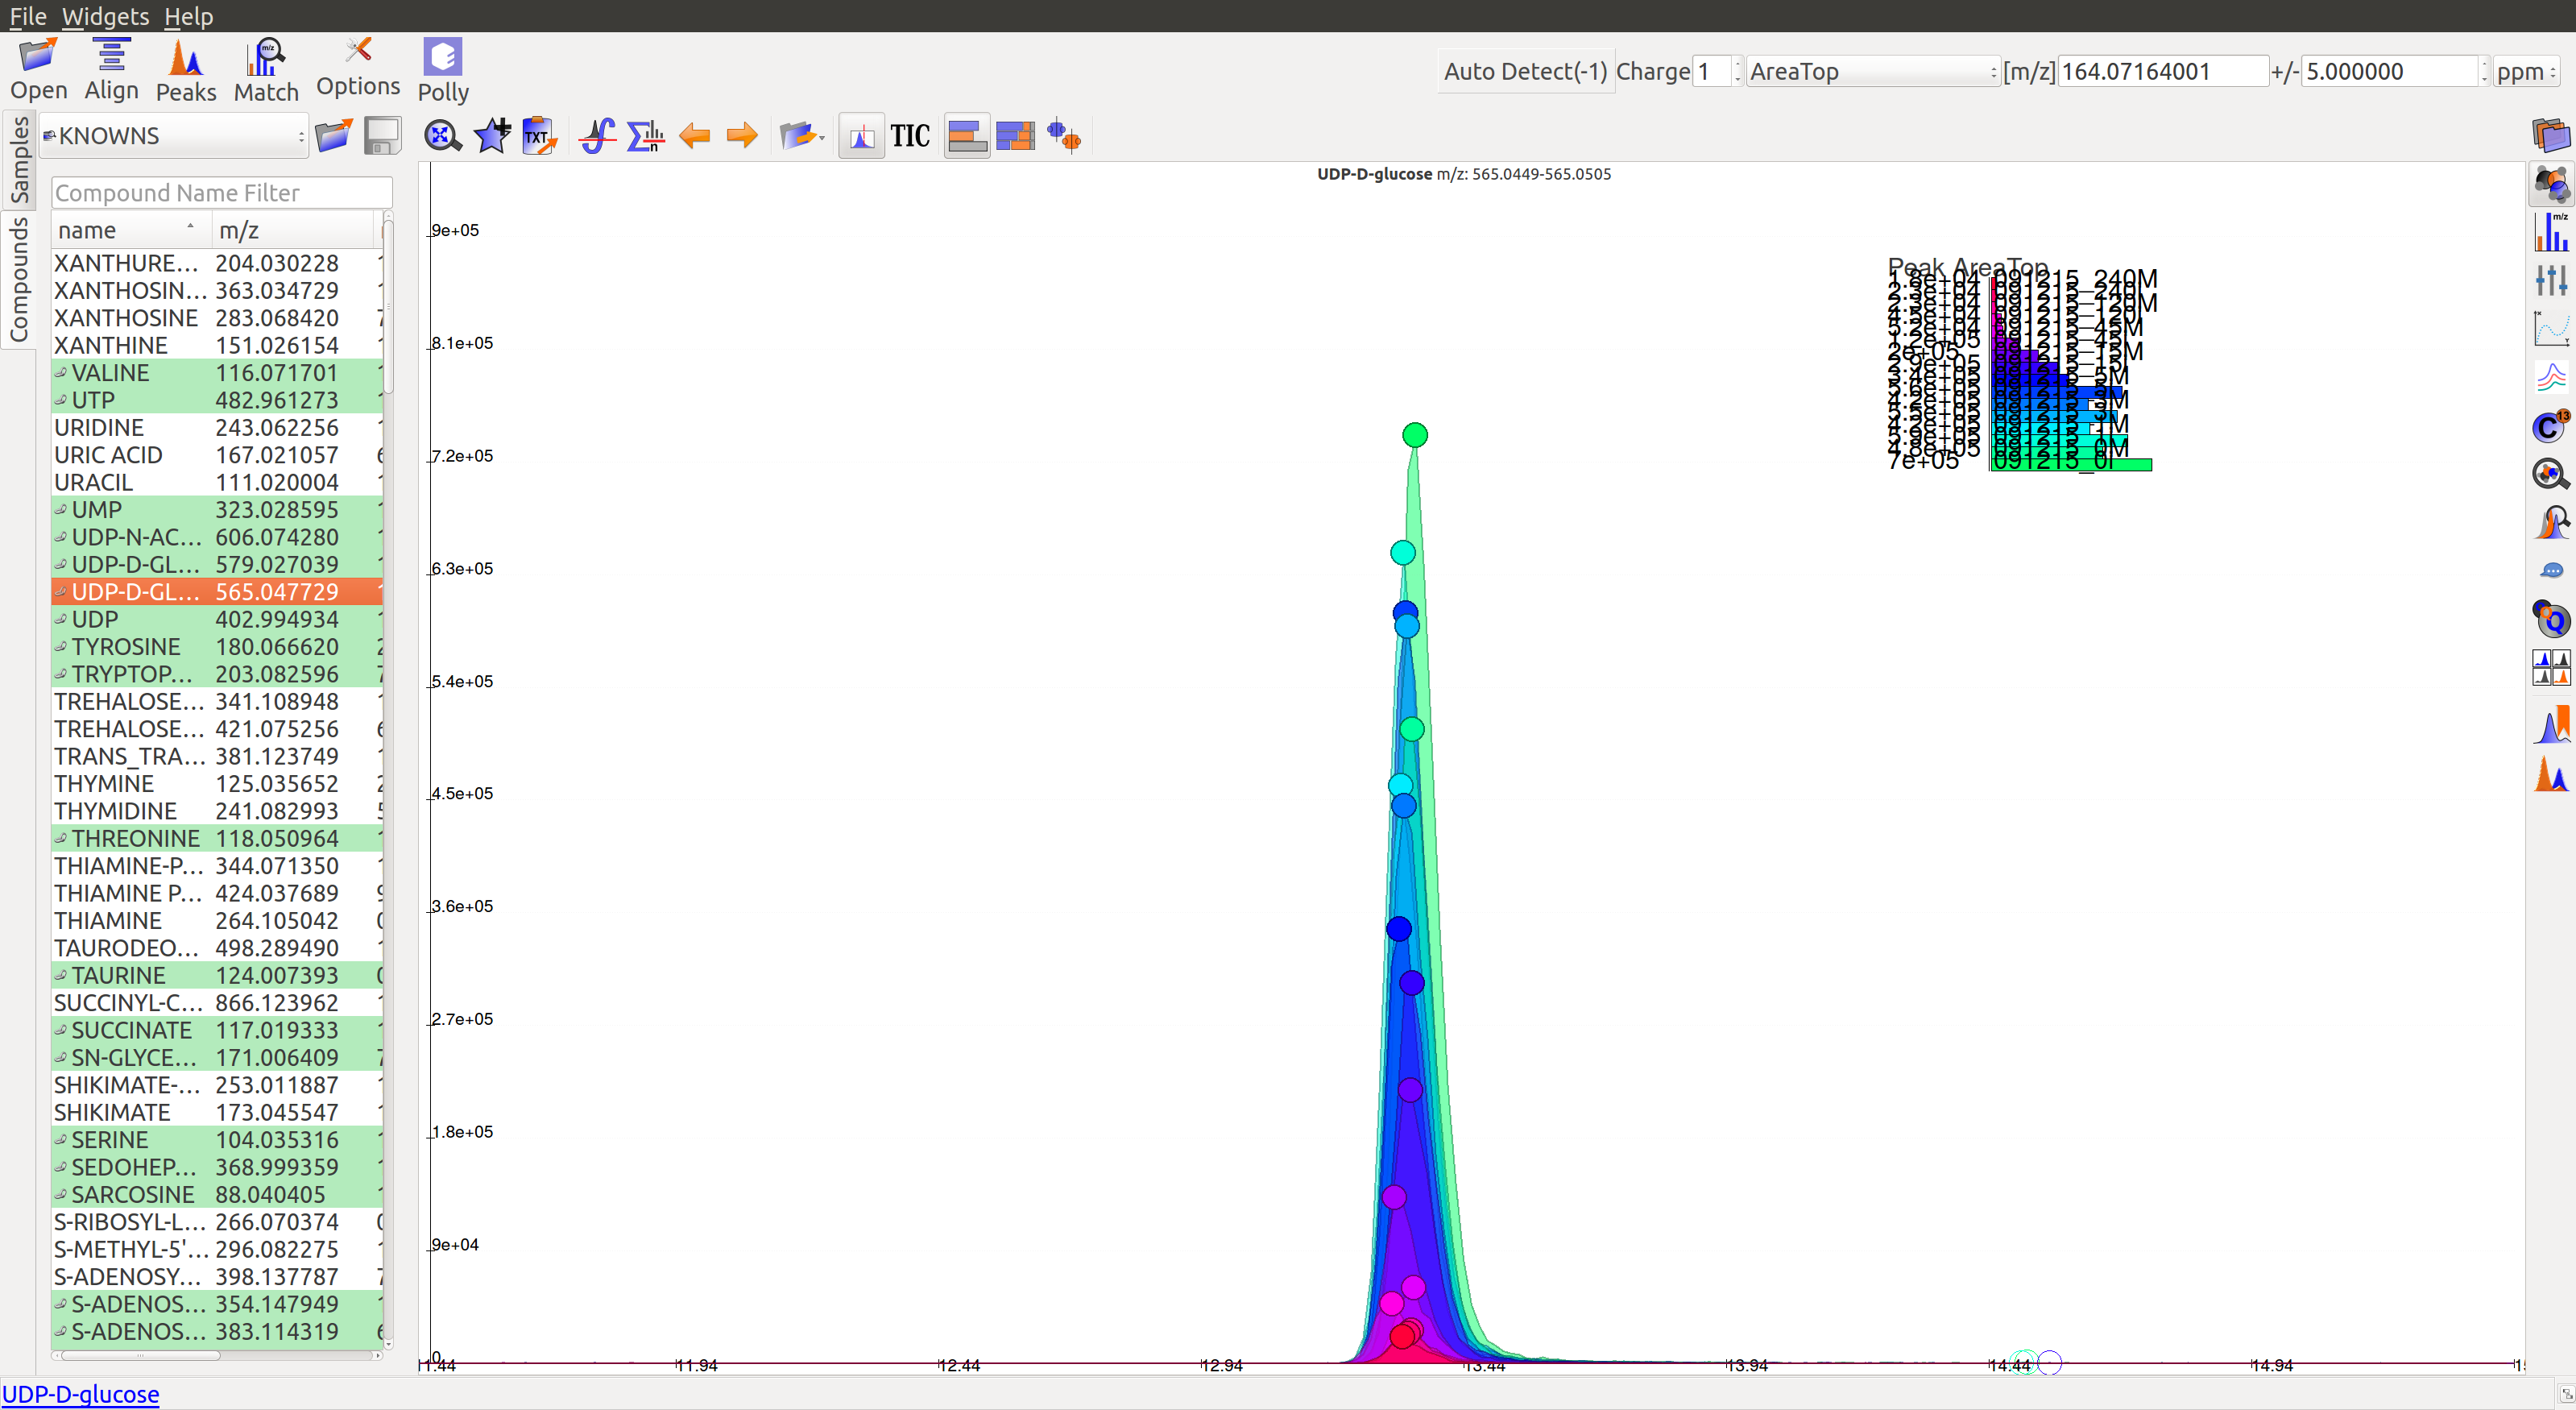
- Gaussian shape
- Perfect grouping, narrow retention time
- Good sample intensities
- Low blank intensities
- QCs look good
- An observable trend in intensity bars of standards, as well as samples.
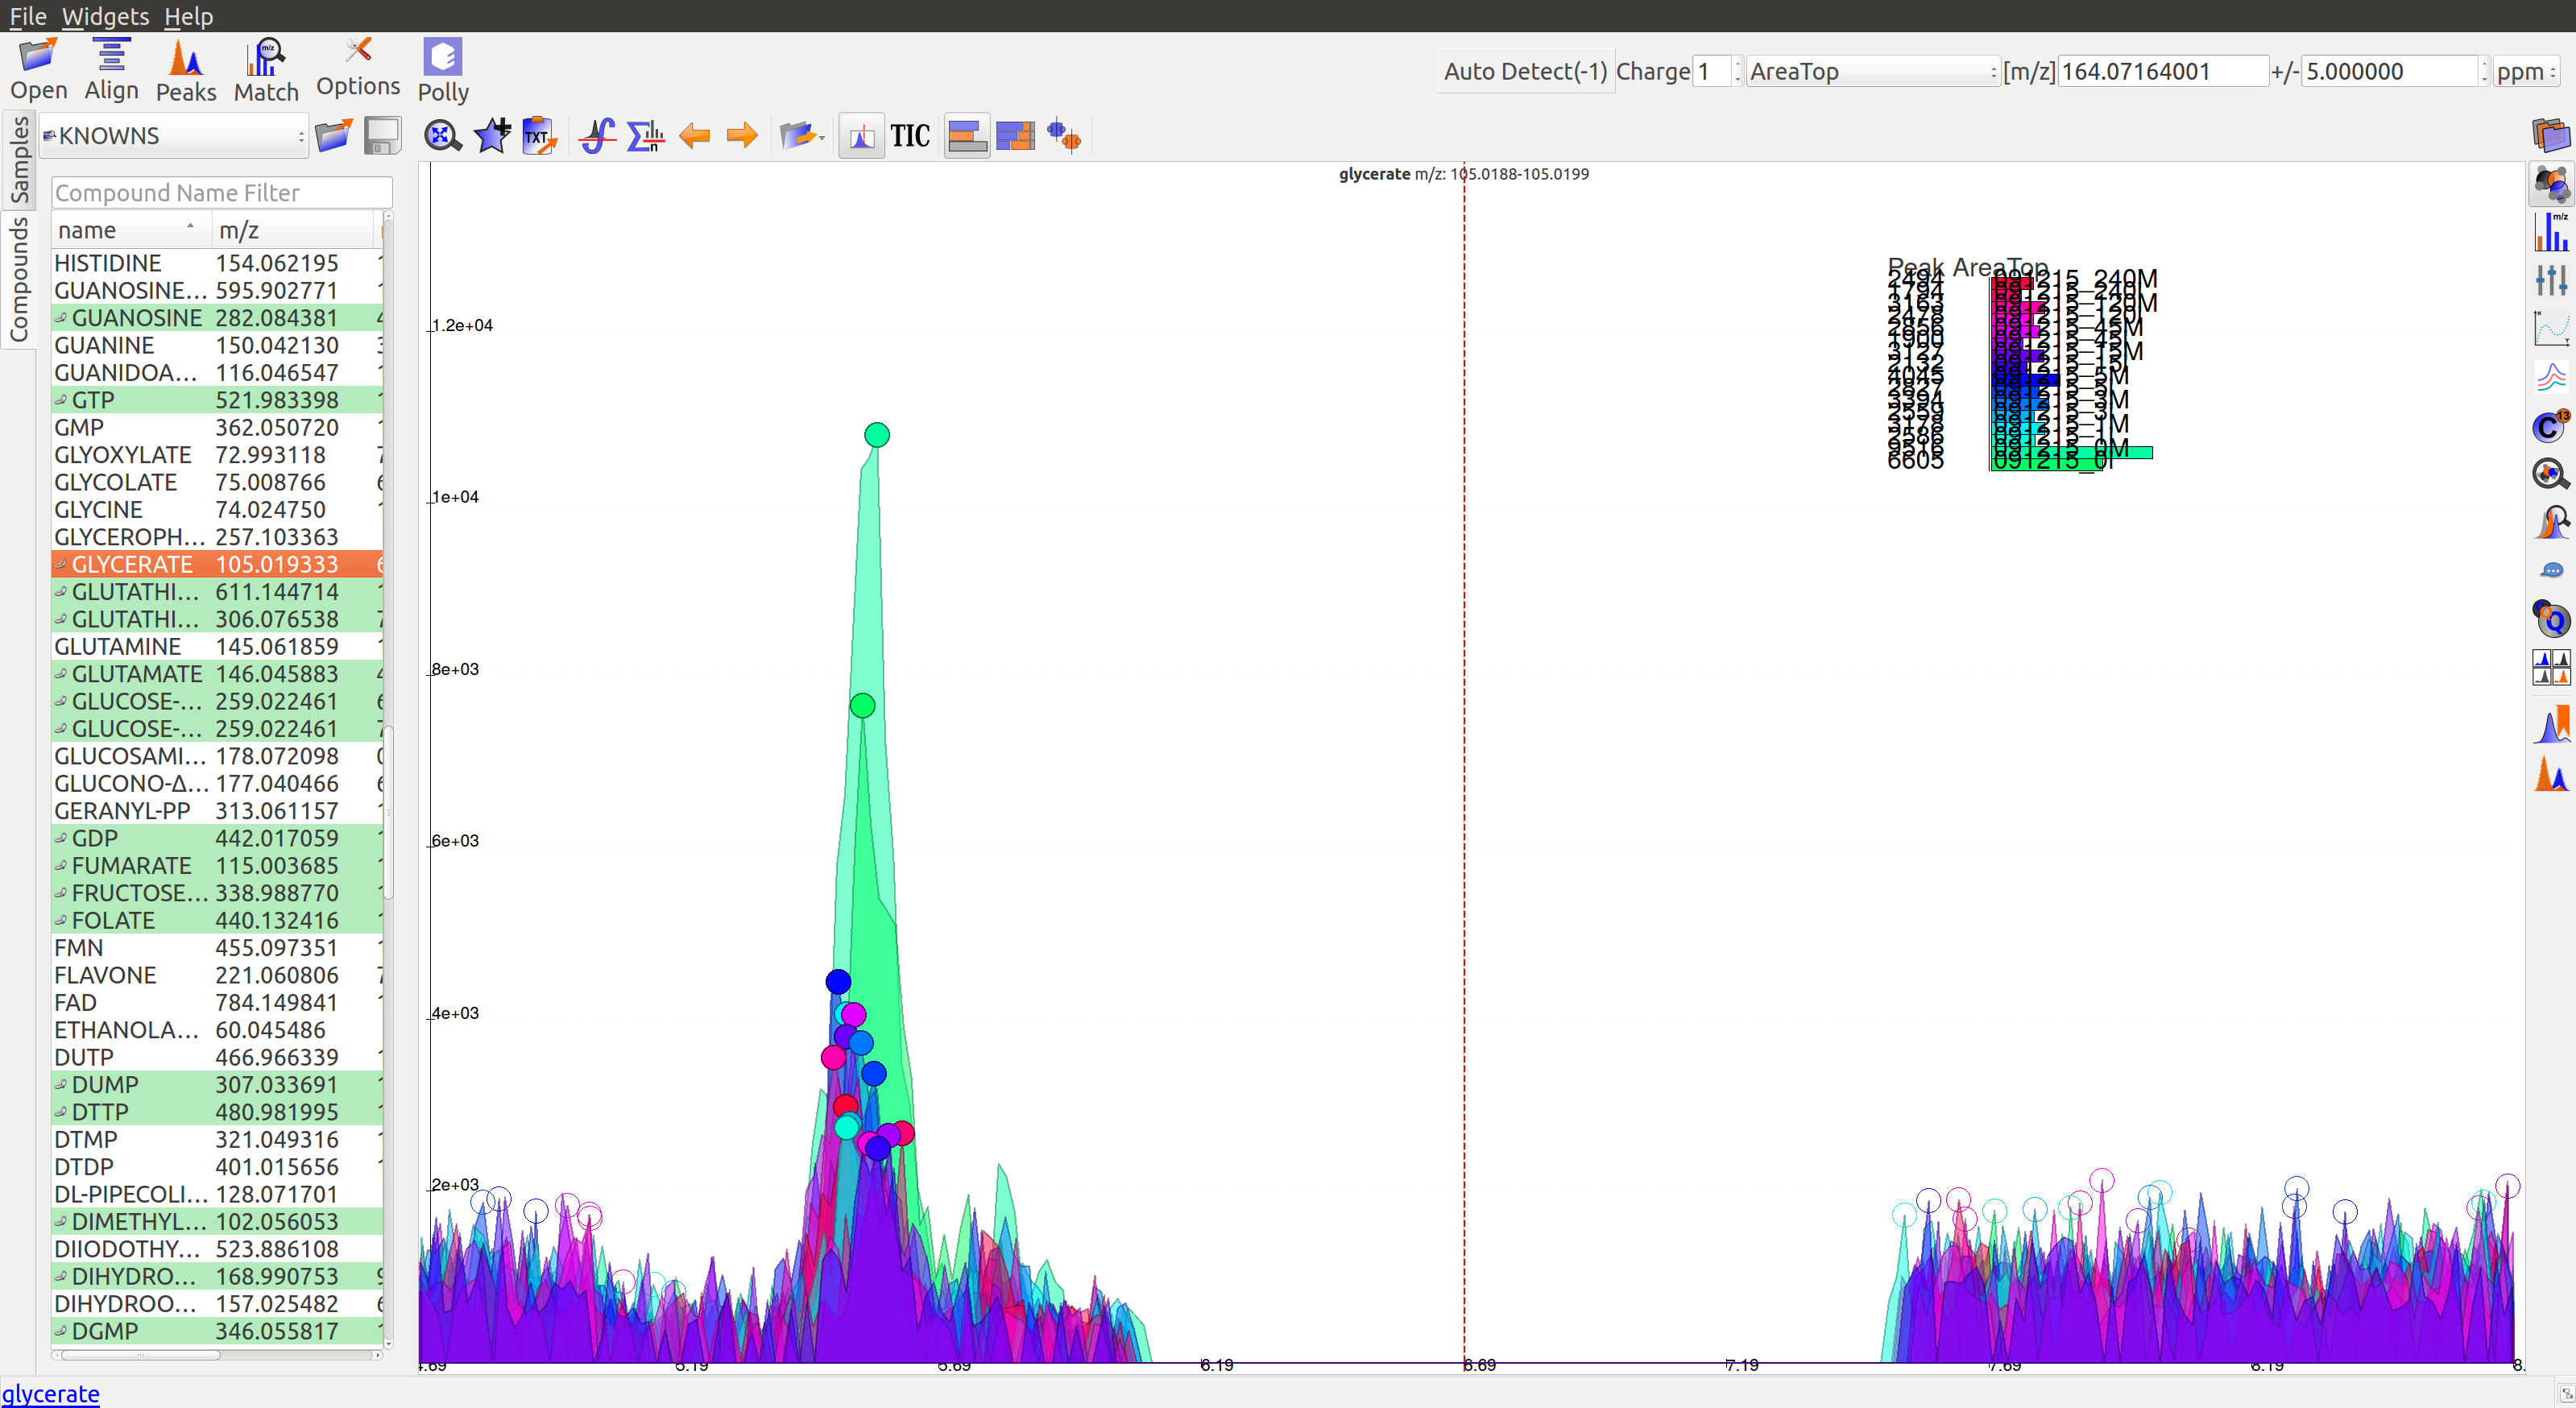
Some examples of bad peaks are given below:
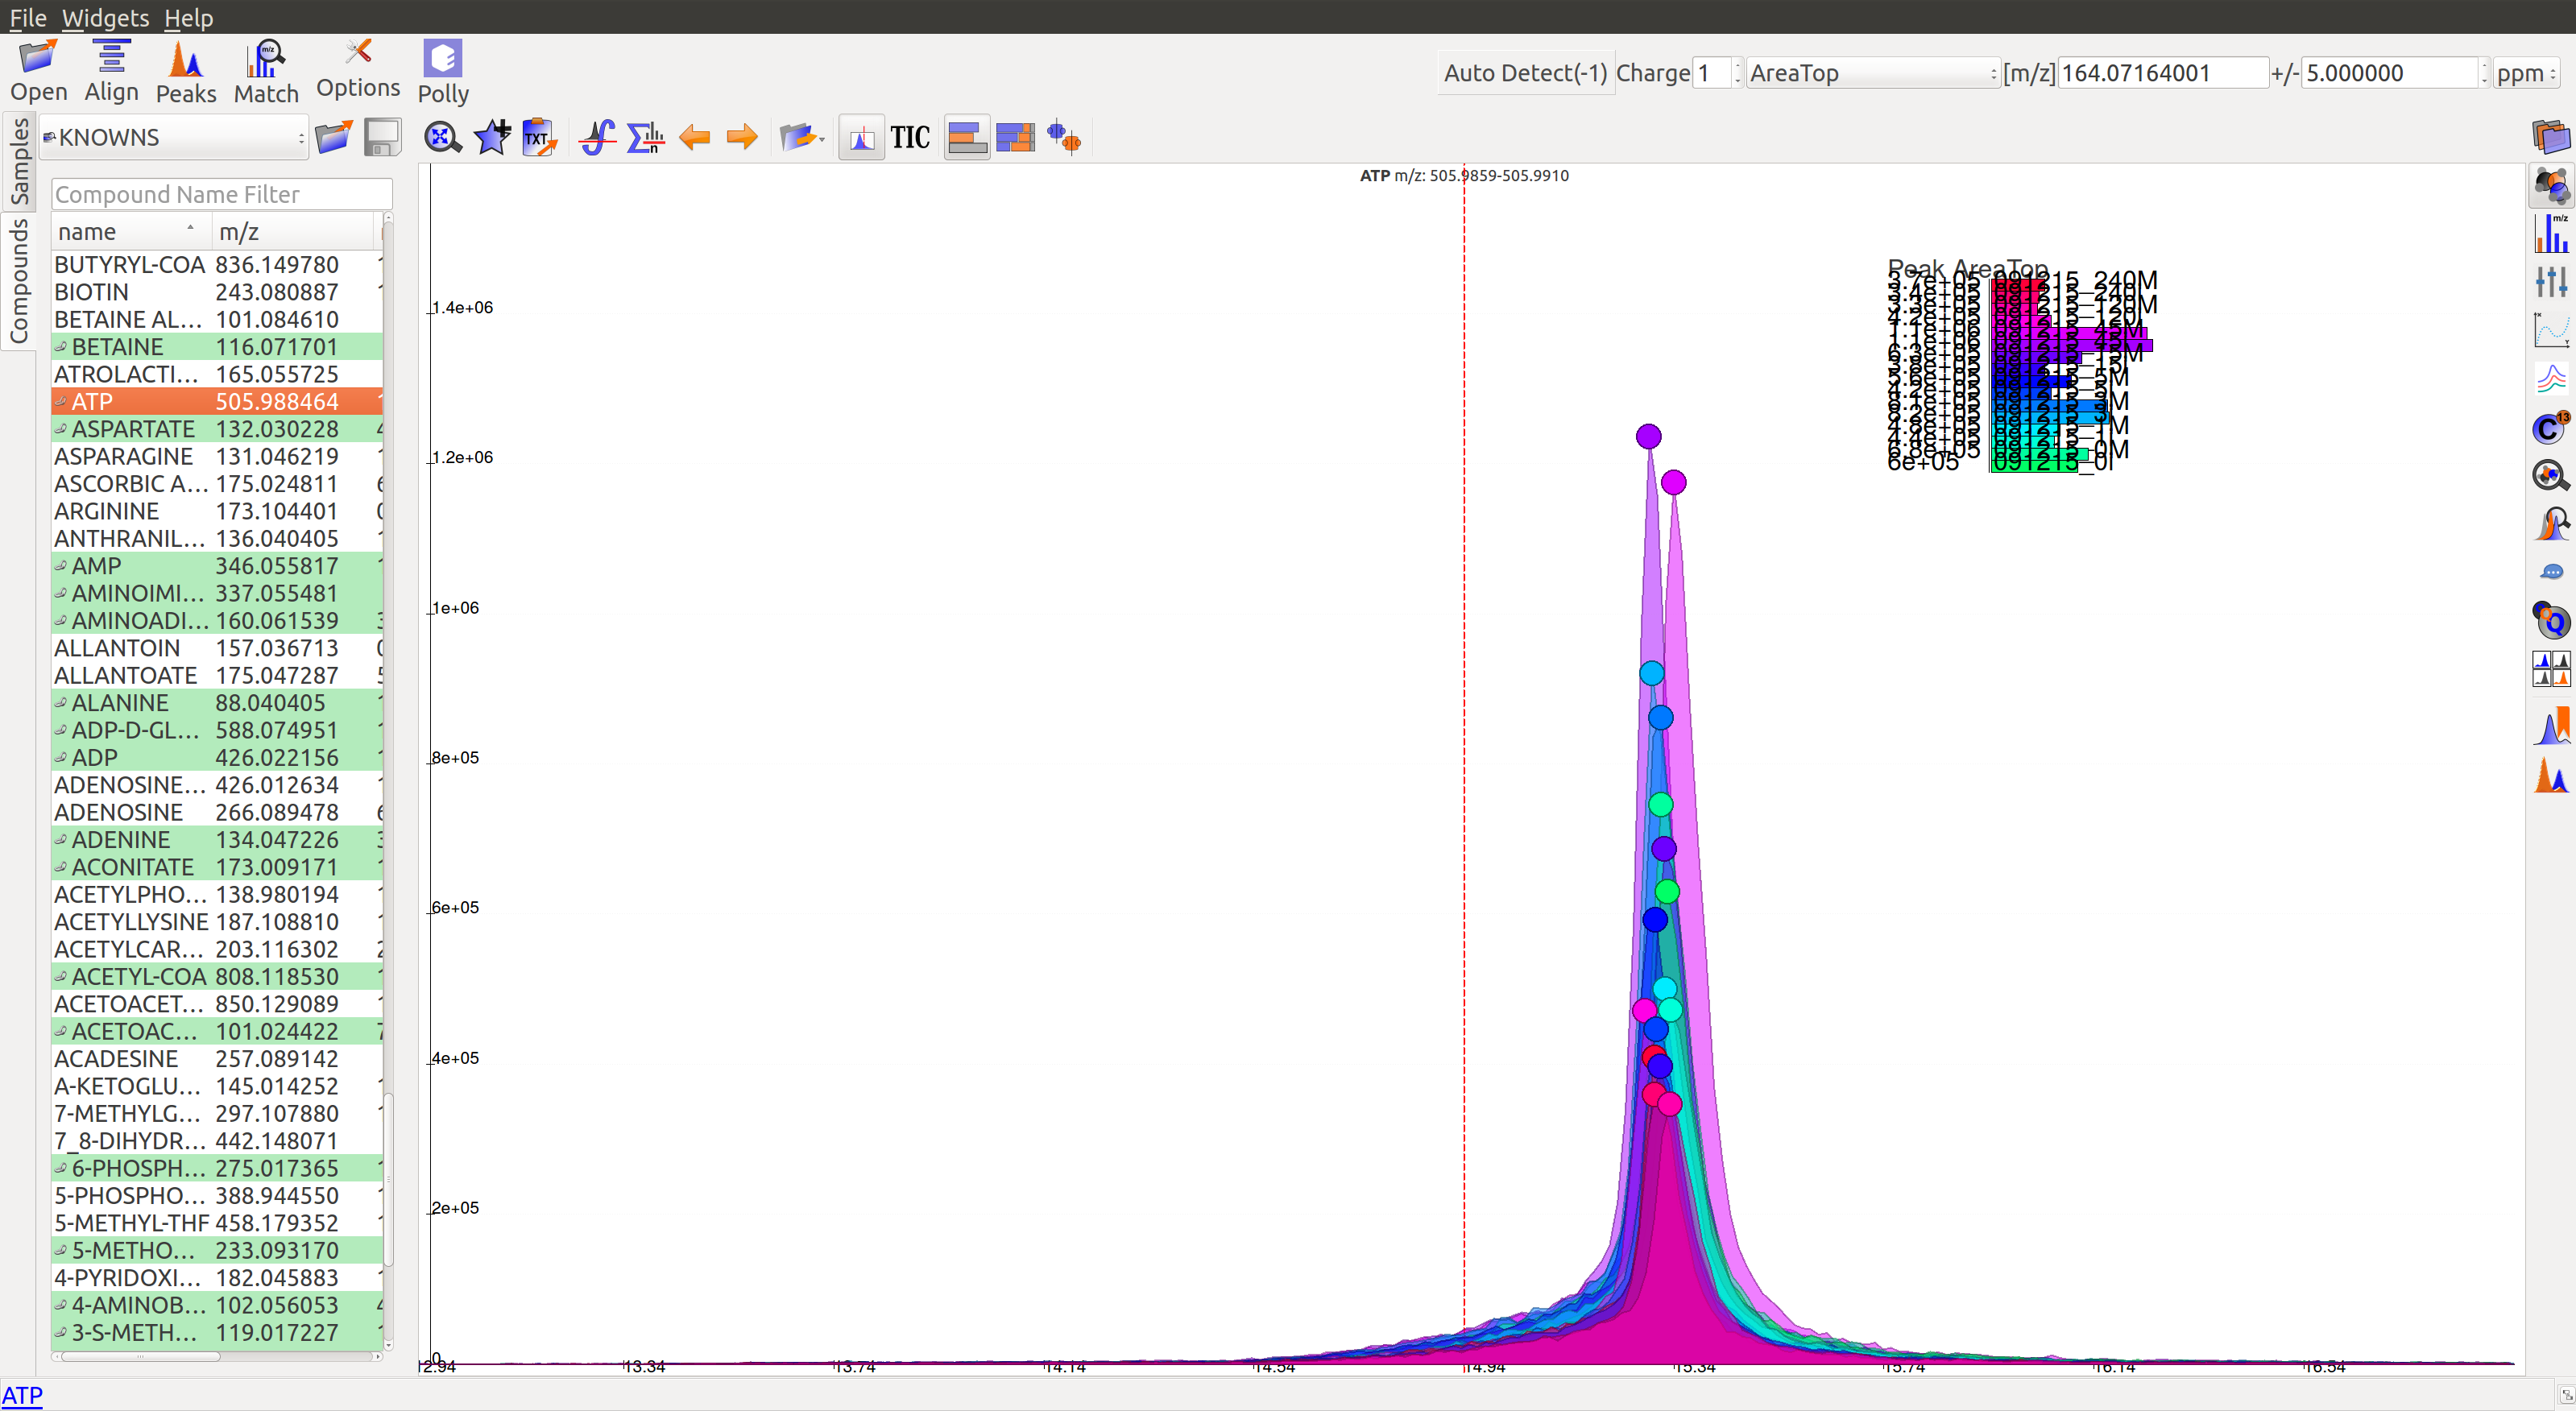
- The peaks have a good Gaussian shape. But the blank intensity bars are high. All the sample intensity bars are shorter or roughly equal to the blank intensities, implying the peaks are most likely noise.
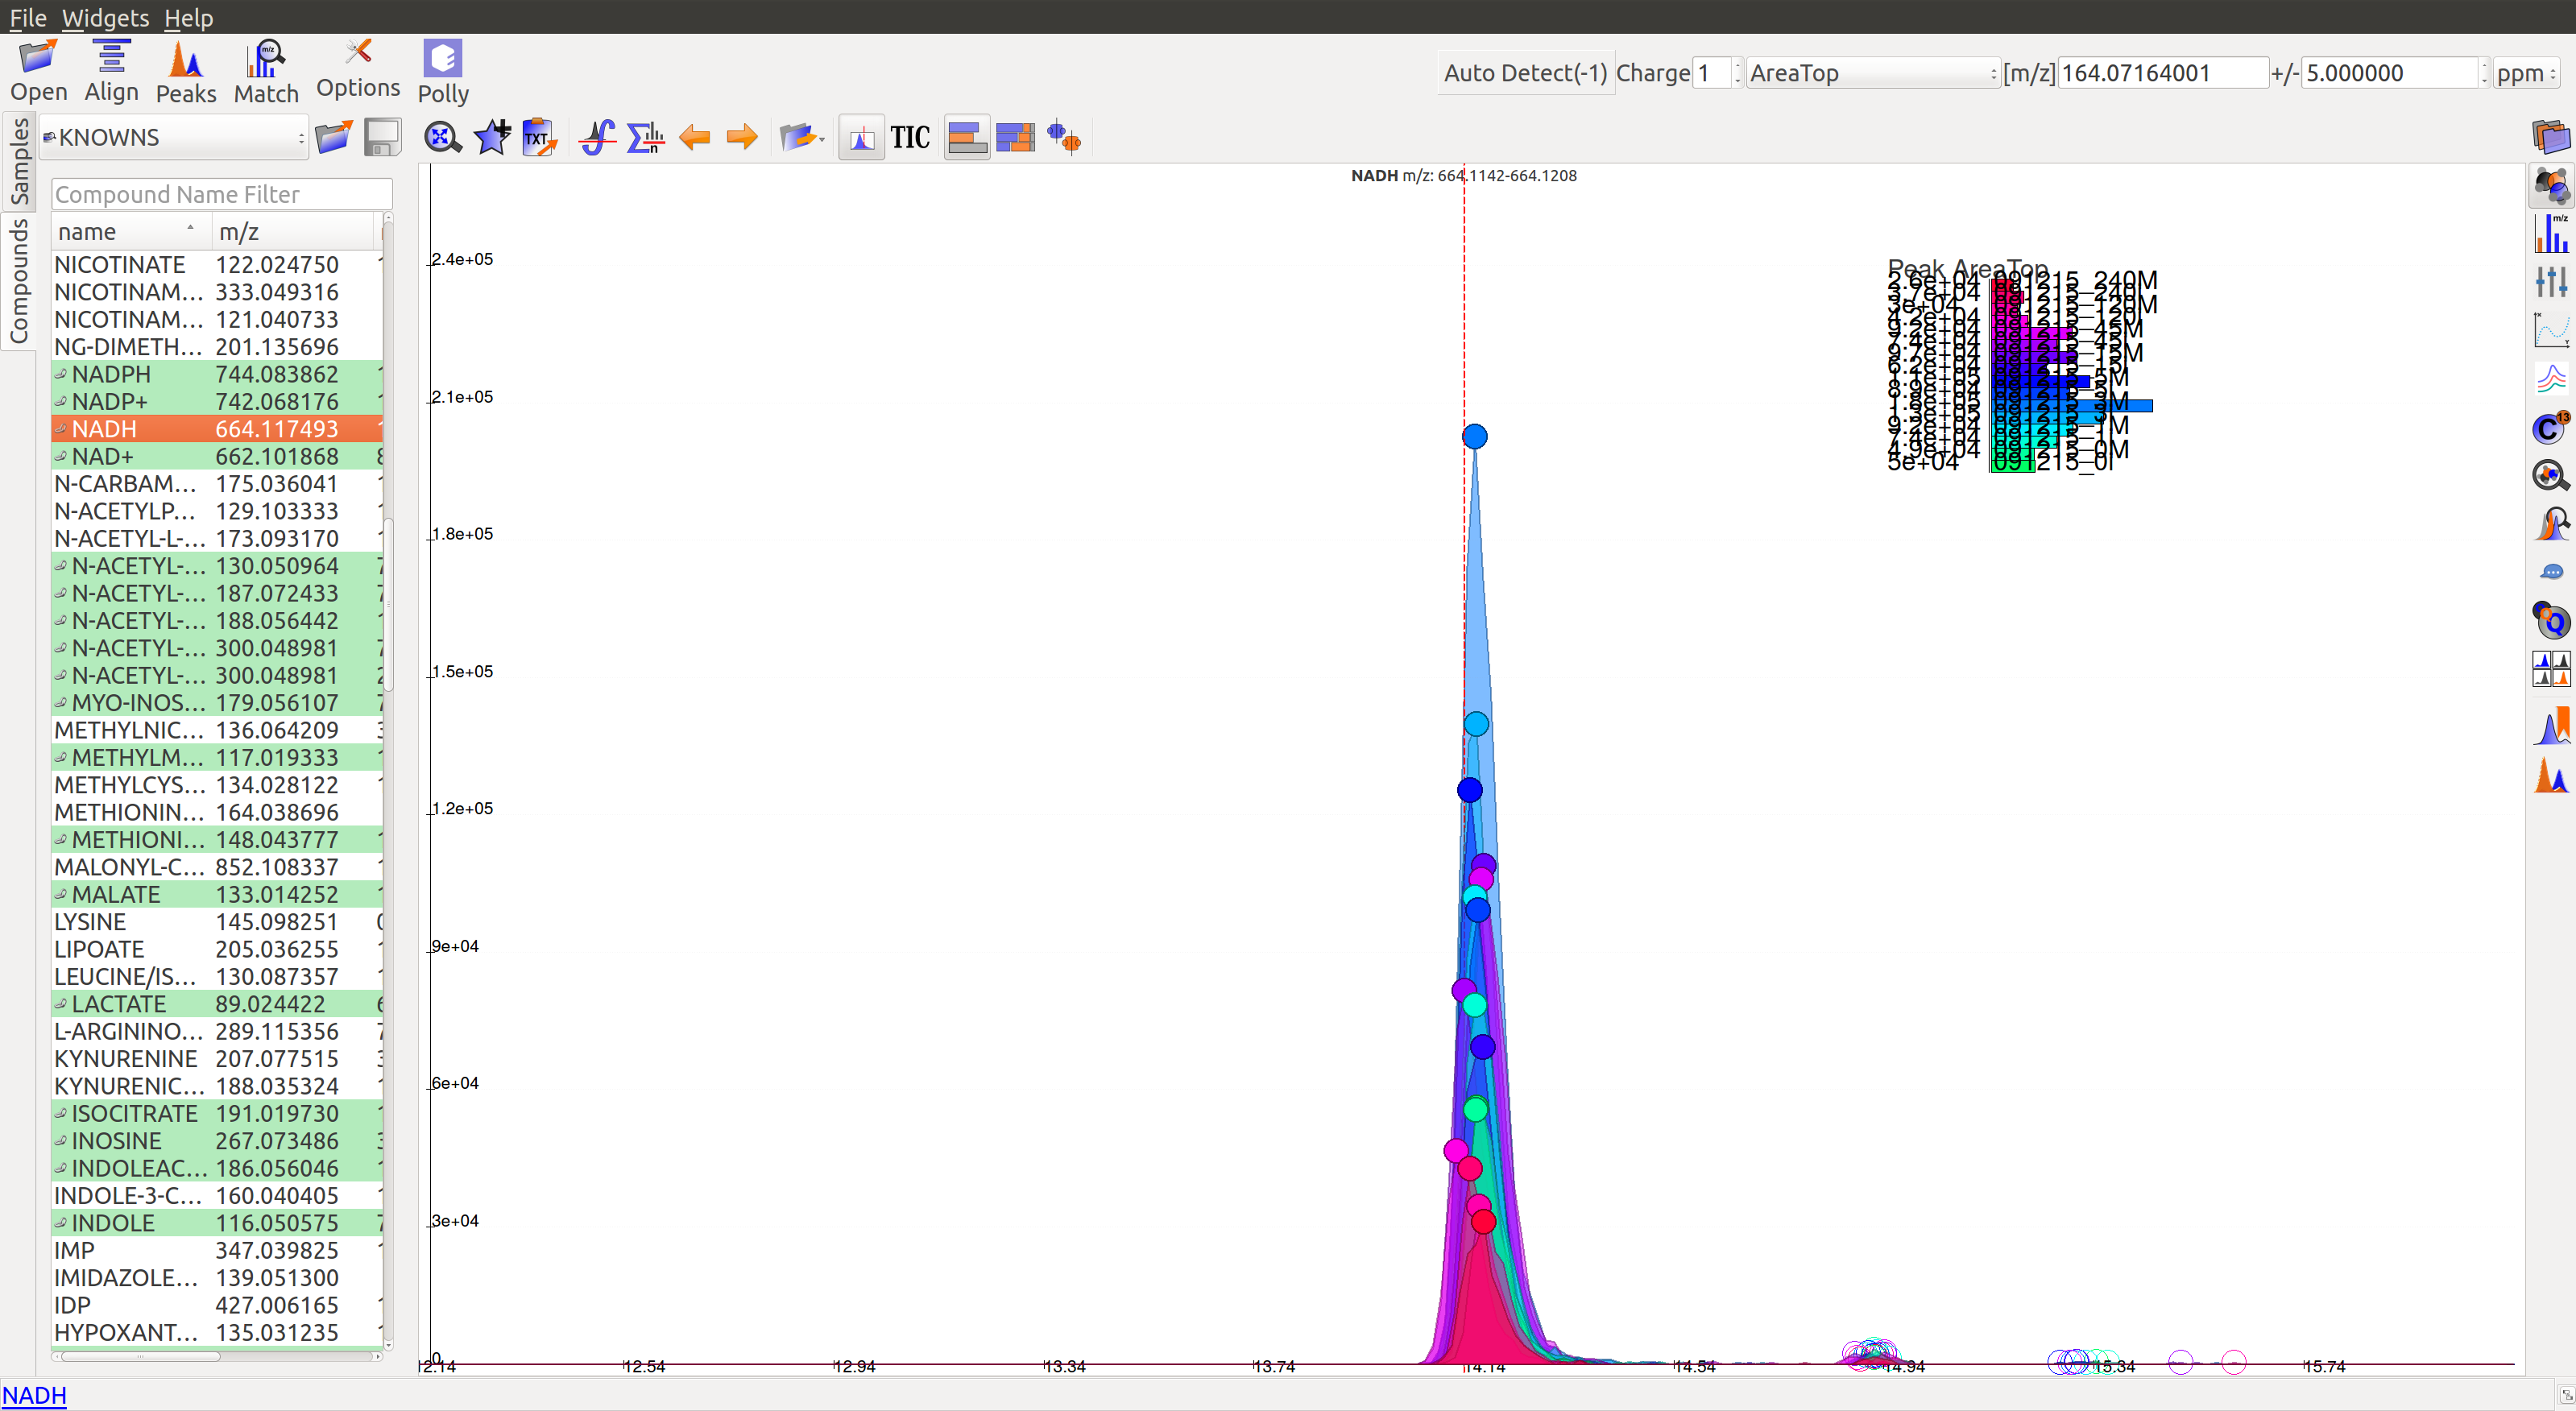
- The intensity levels are low relatively. The peaks are spread over a long range of retention time. They have poor shape, poor grouping and lie close to noise. If the signal to noise ratio was improved, this peak would probably not be detected.
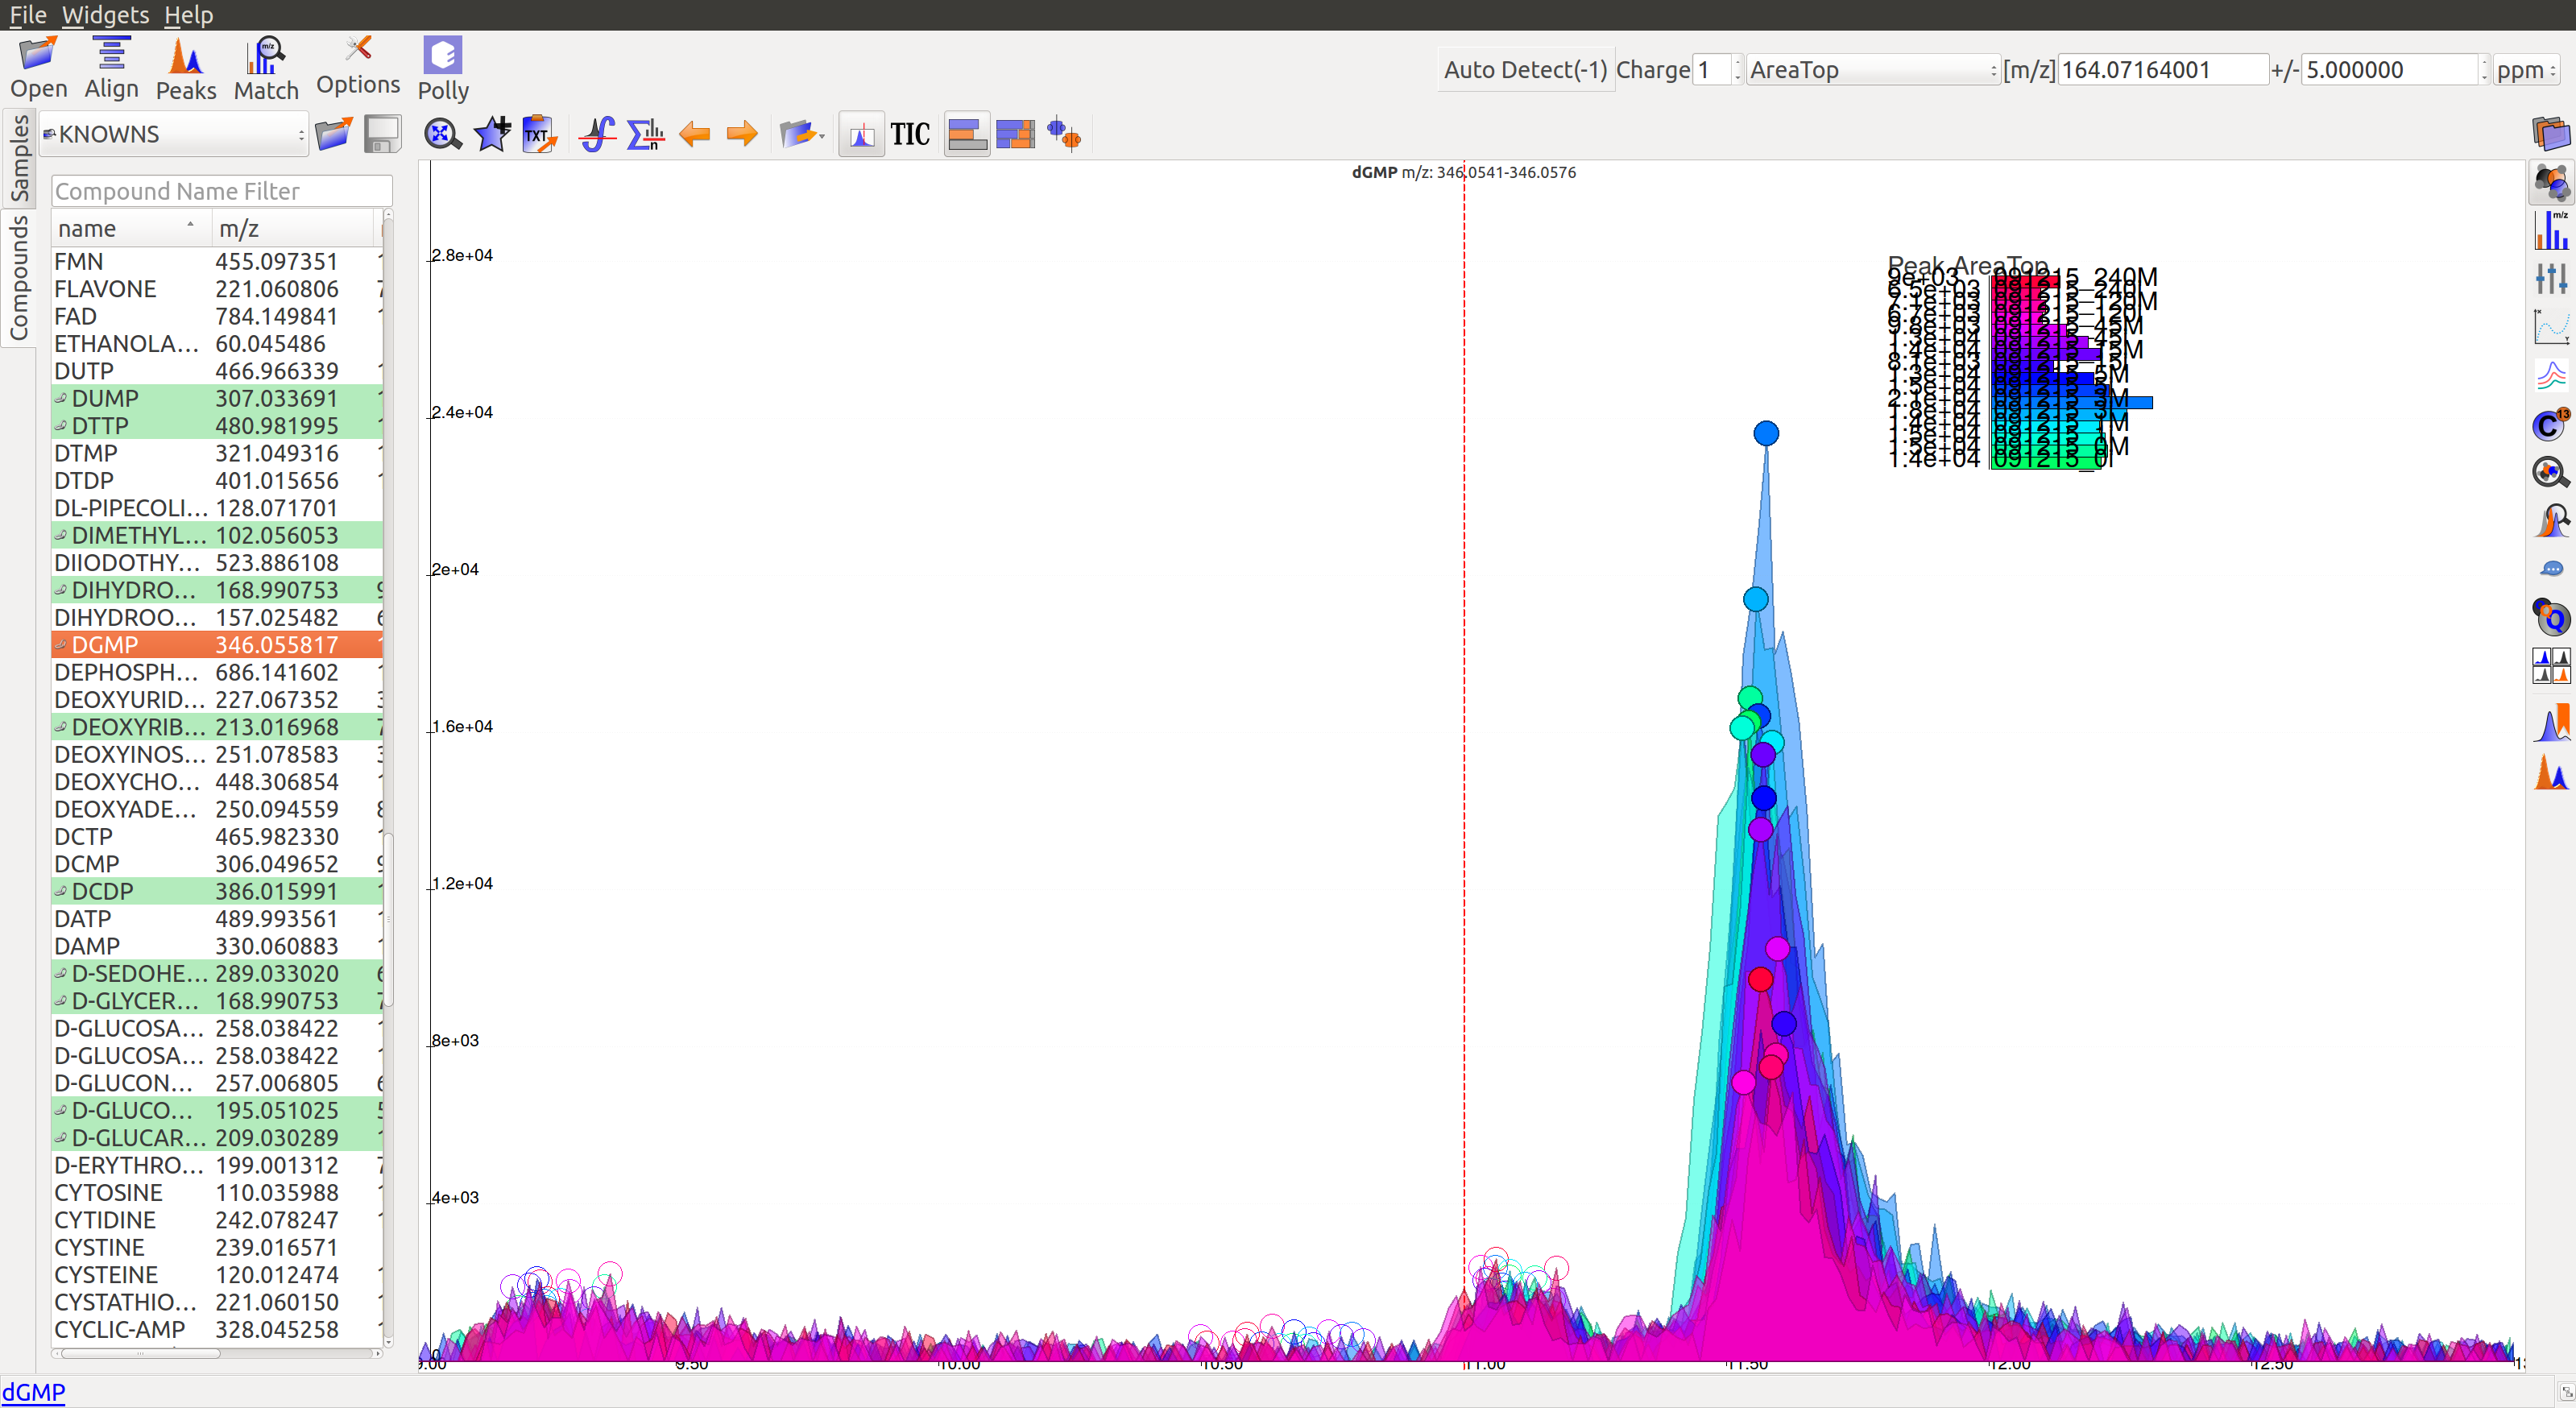
- In the following image, many sample intensities are missing from the intensities bar plots. Peaks do not have a Gaussian shape, nor good grouping. These peaks are probably noise which have been wrongly annotated.
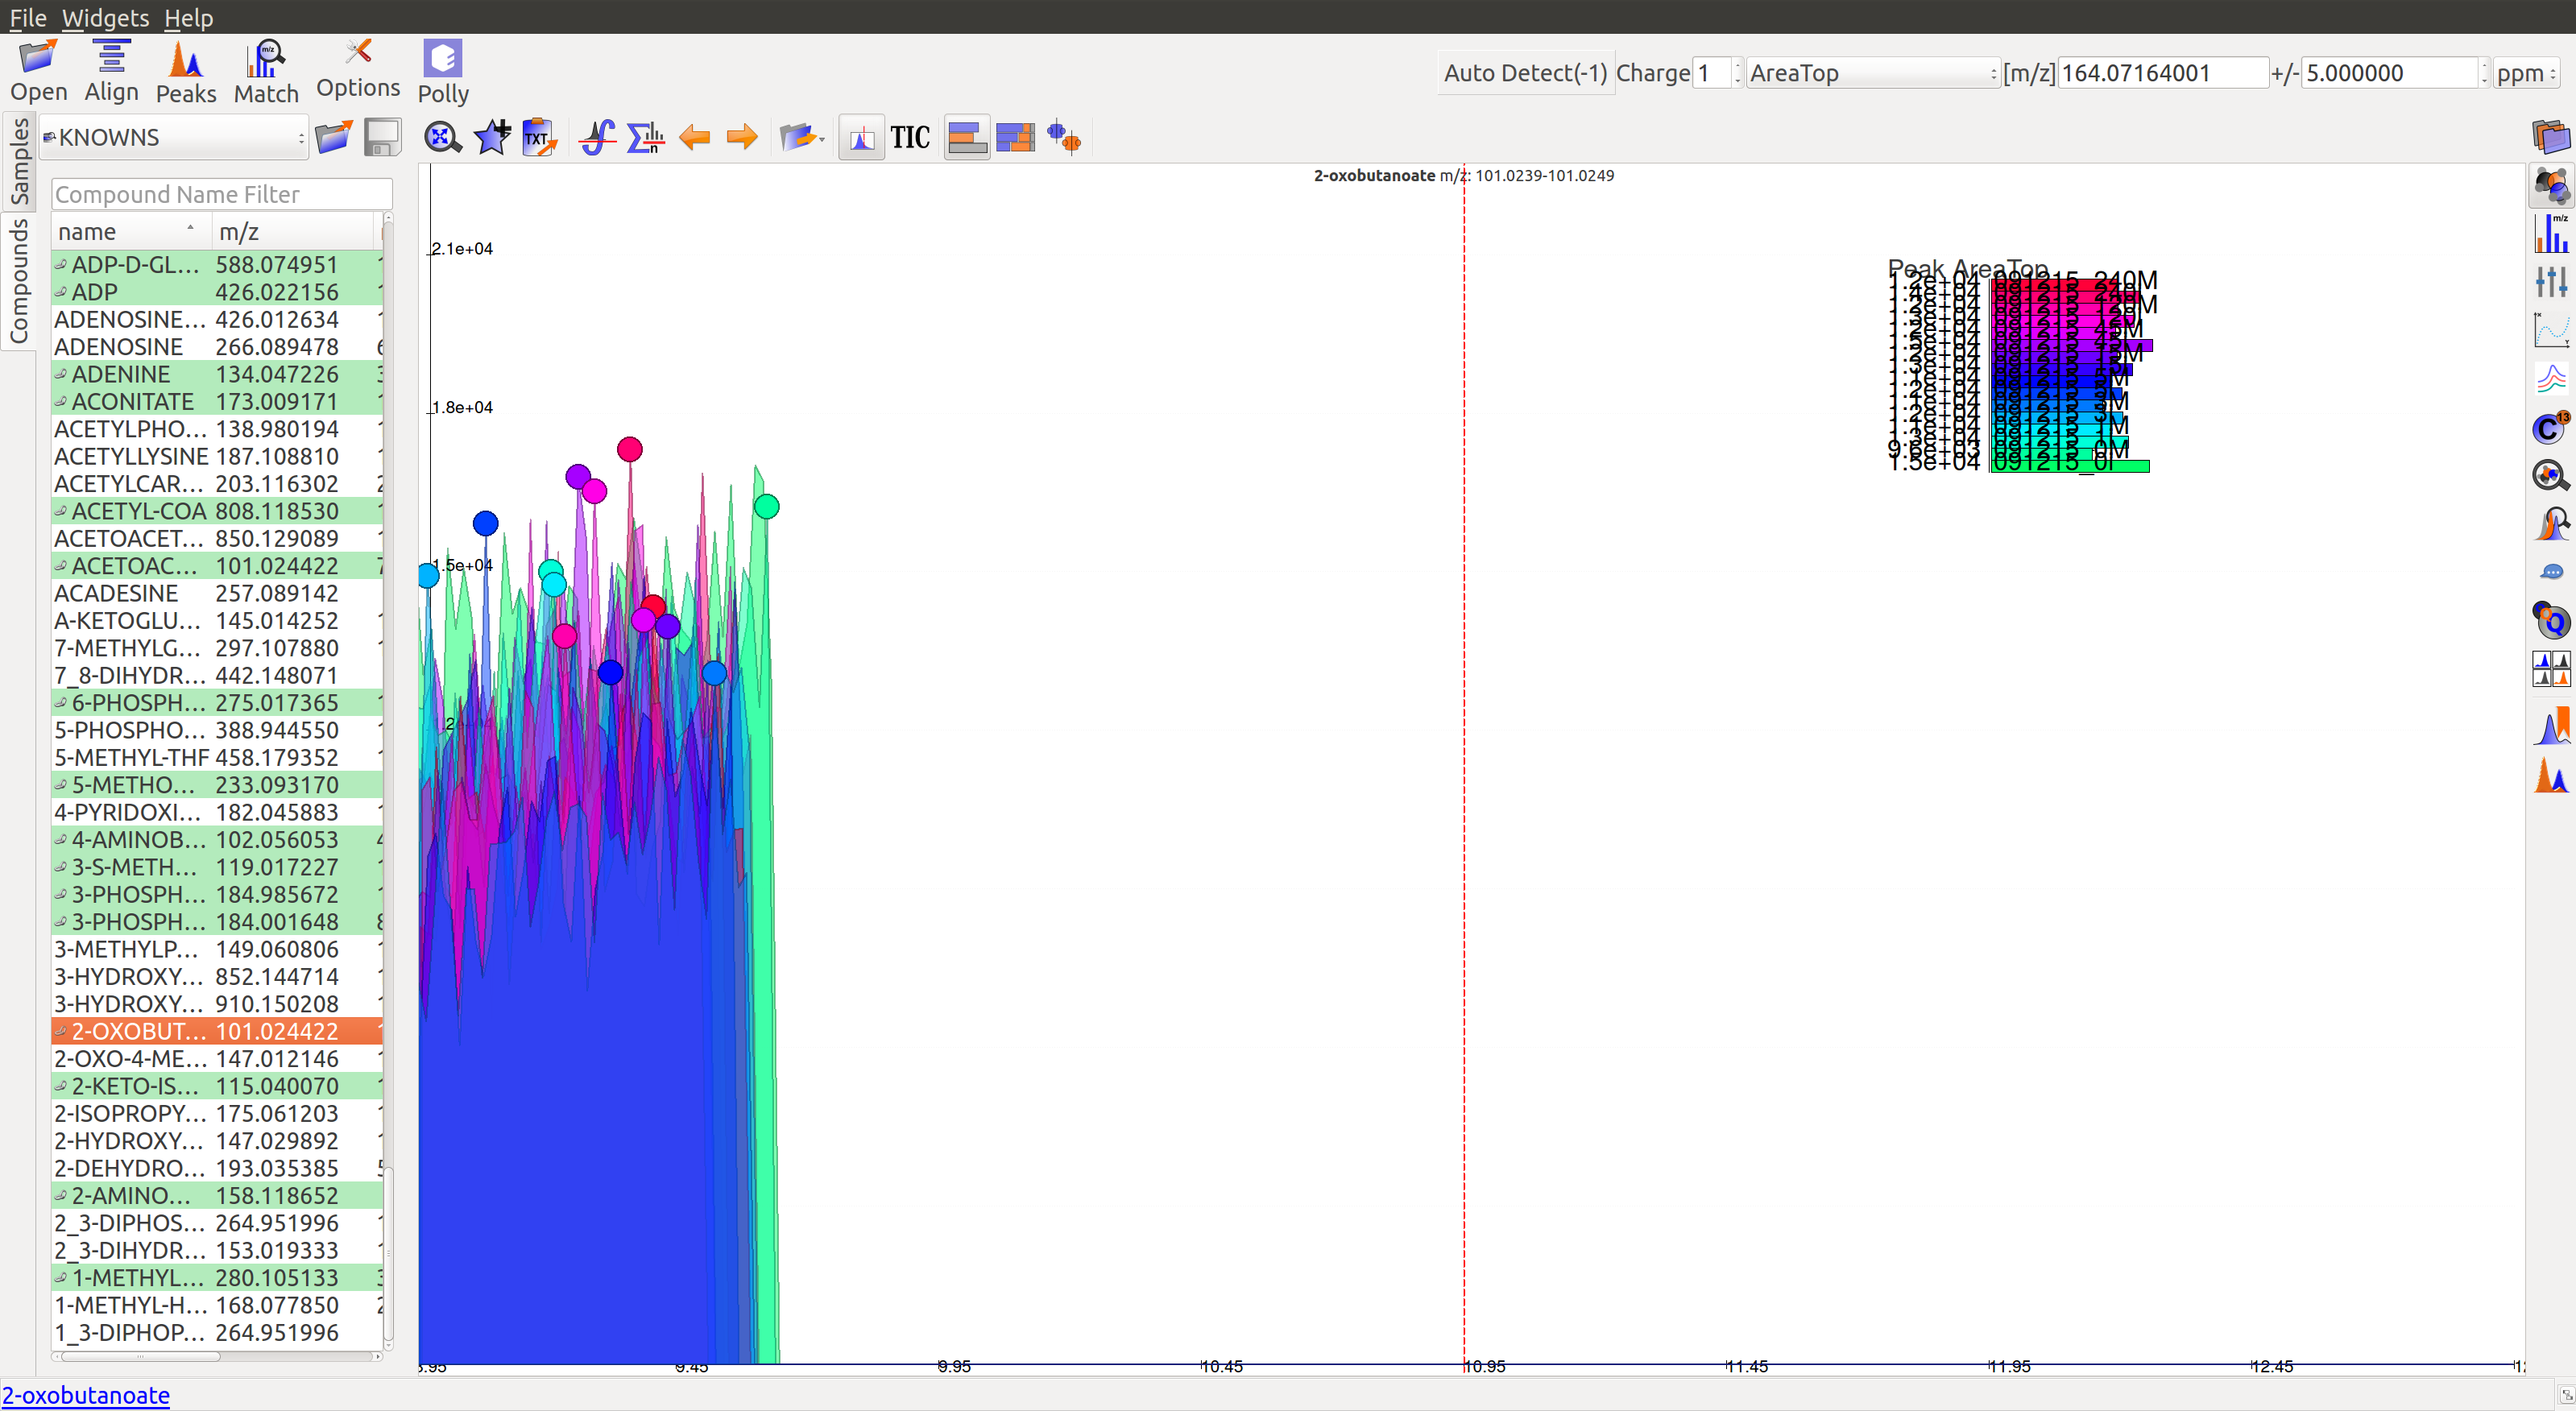
- This is a noisy group. There are no discrete peaks visible in the image. The X-axis is crowded with noise. The peak shape is sharp, triangular, or line-like; not Gaussian. The intensity levels are high, but so are noise levels.
More examples of noisy peaks:
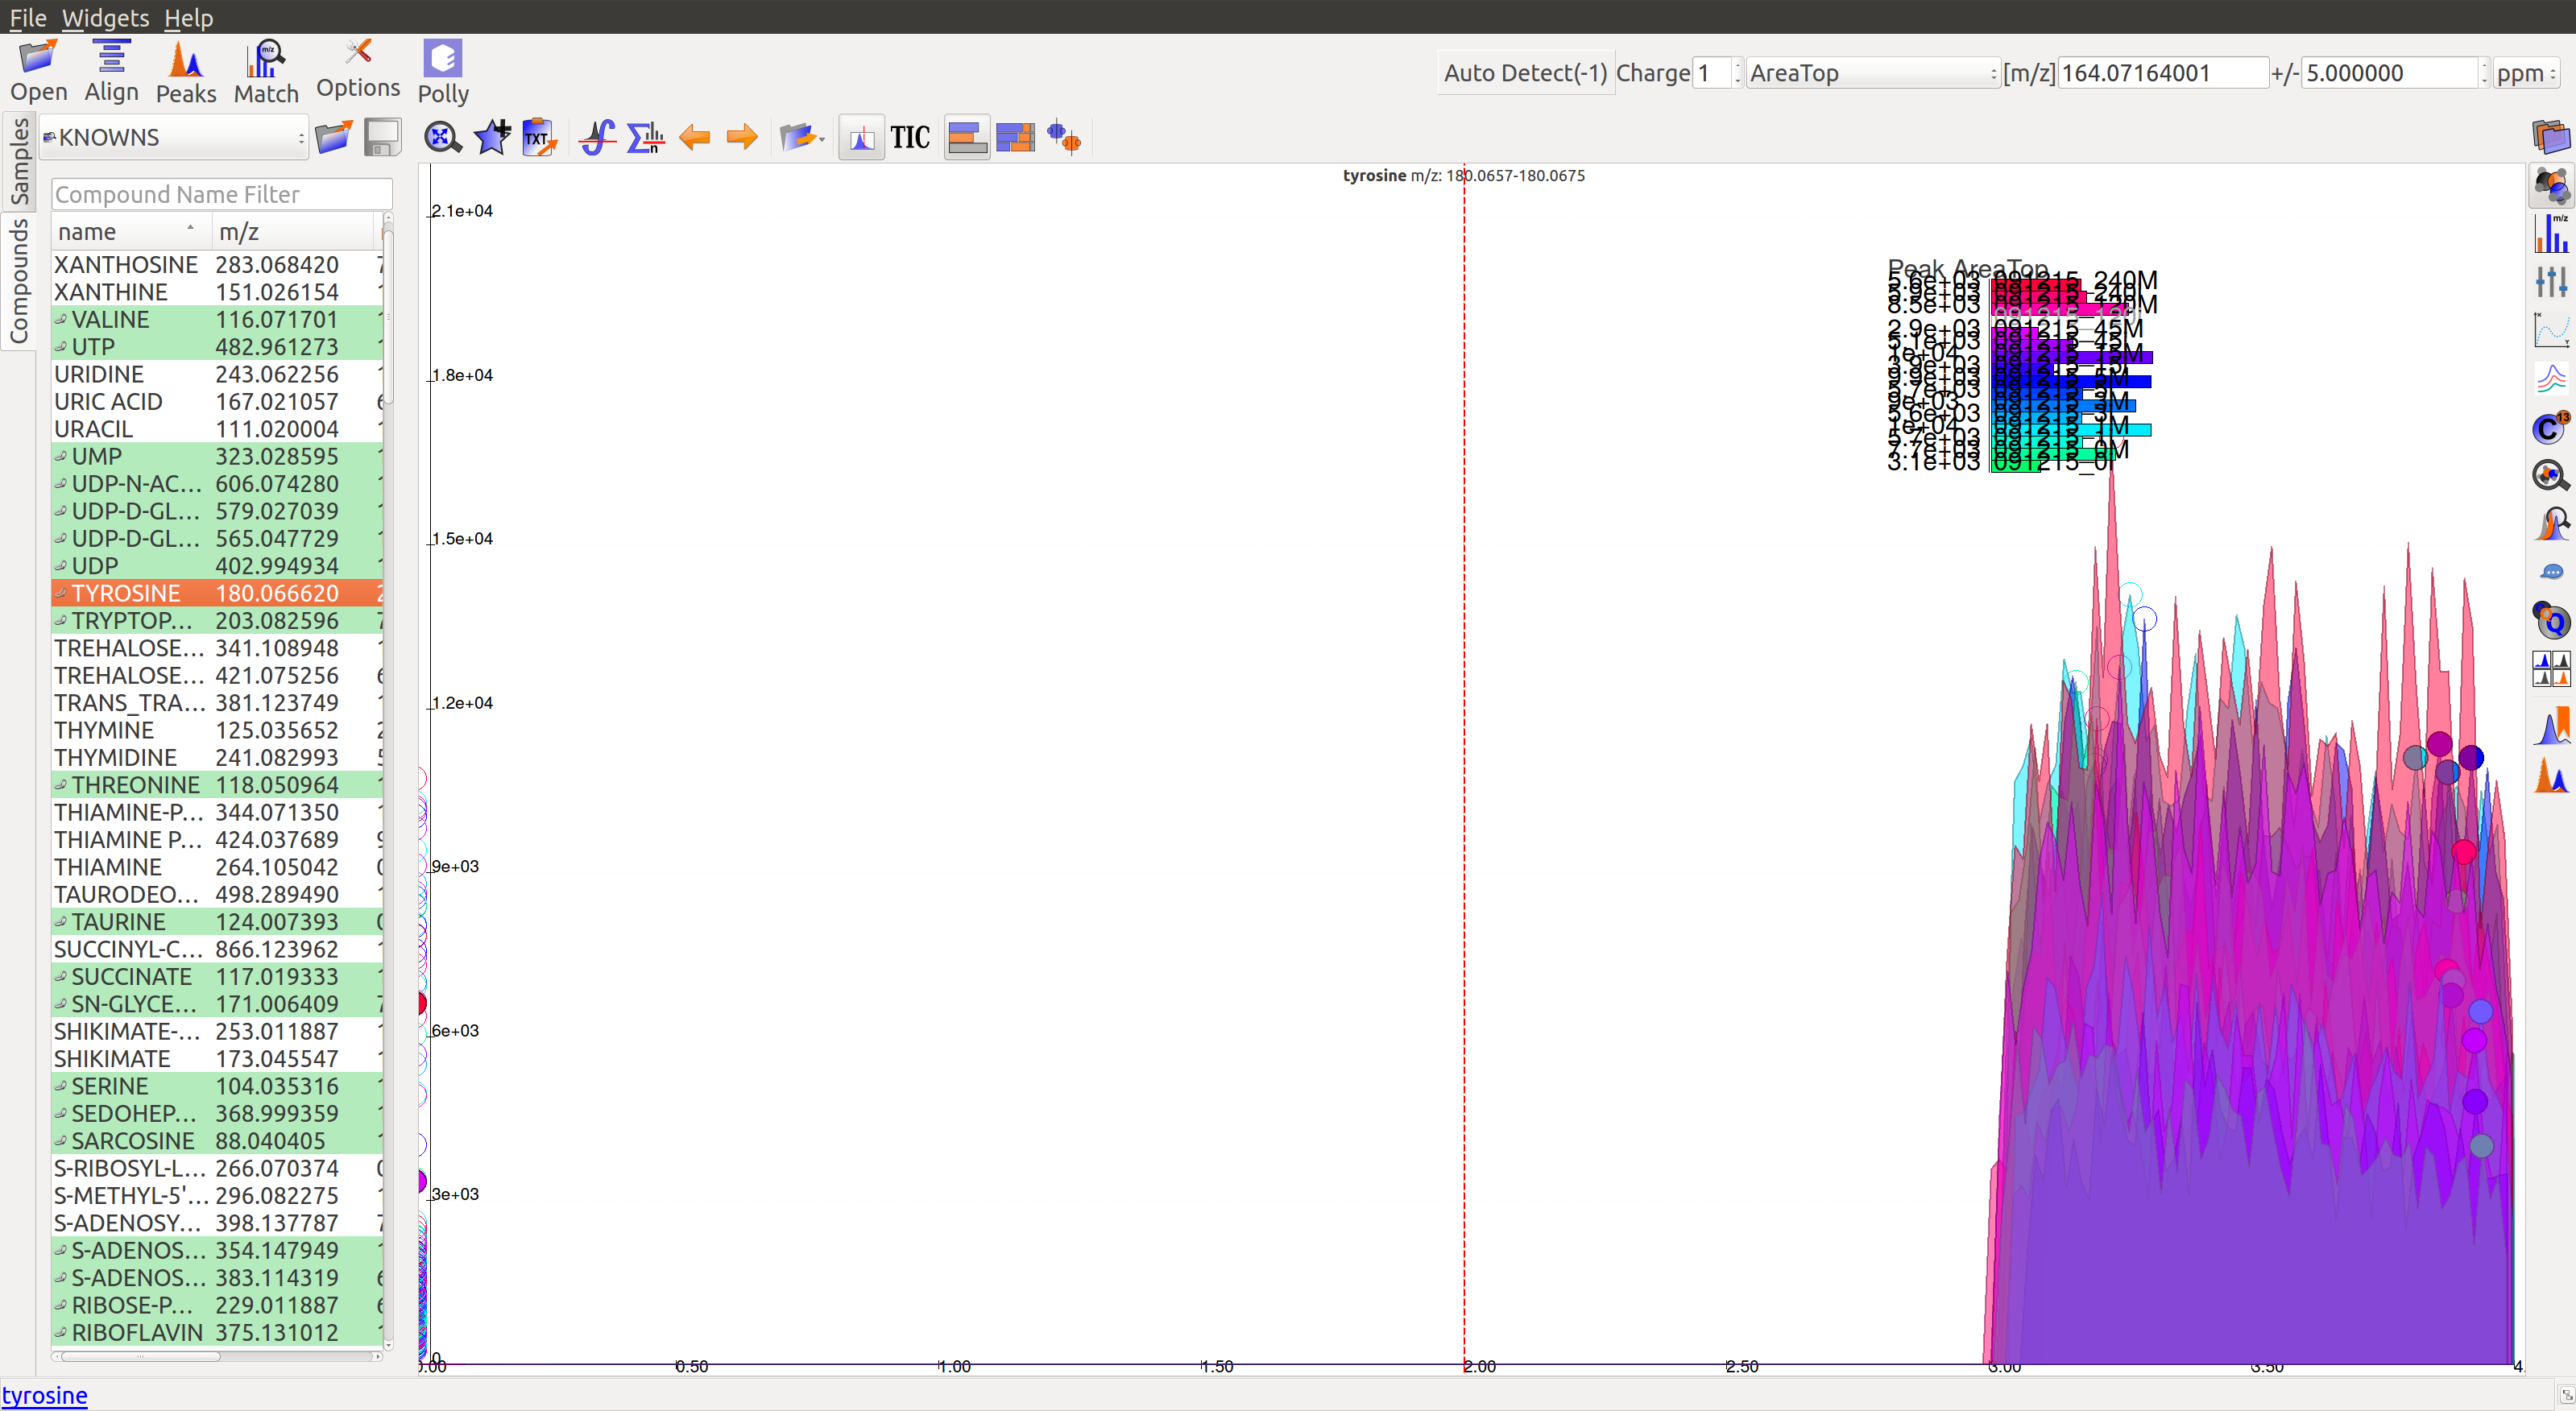
- The peaks don’t have a Gaussian shape, and are also noisy. The intensity values are very low.
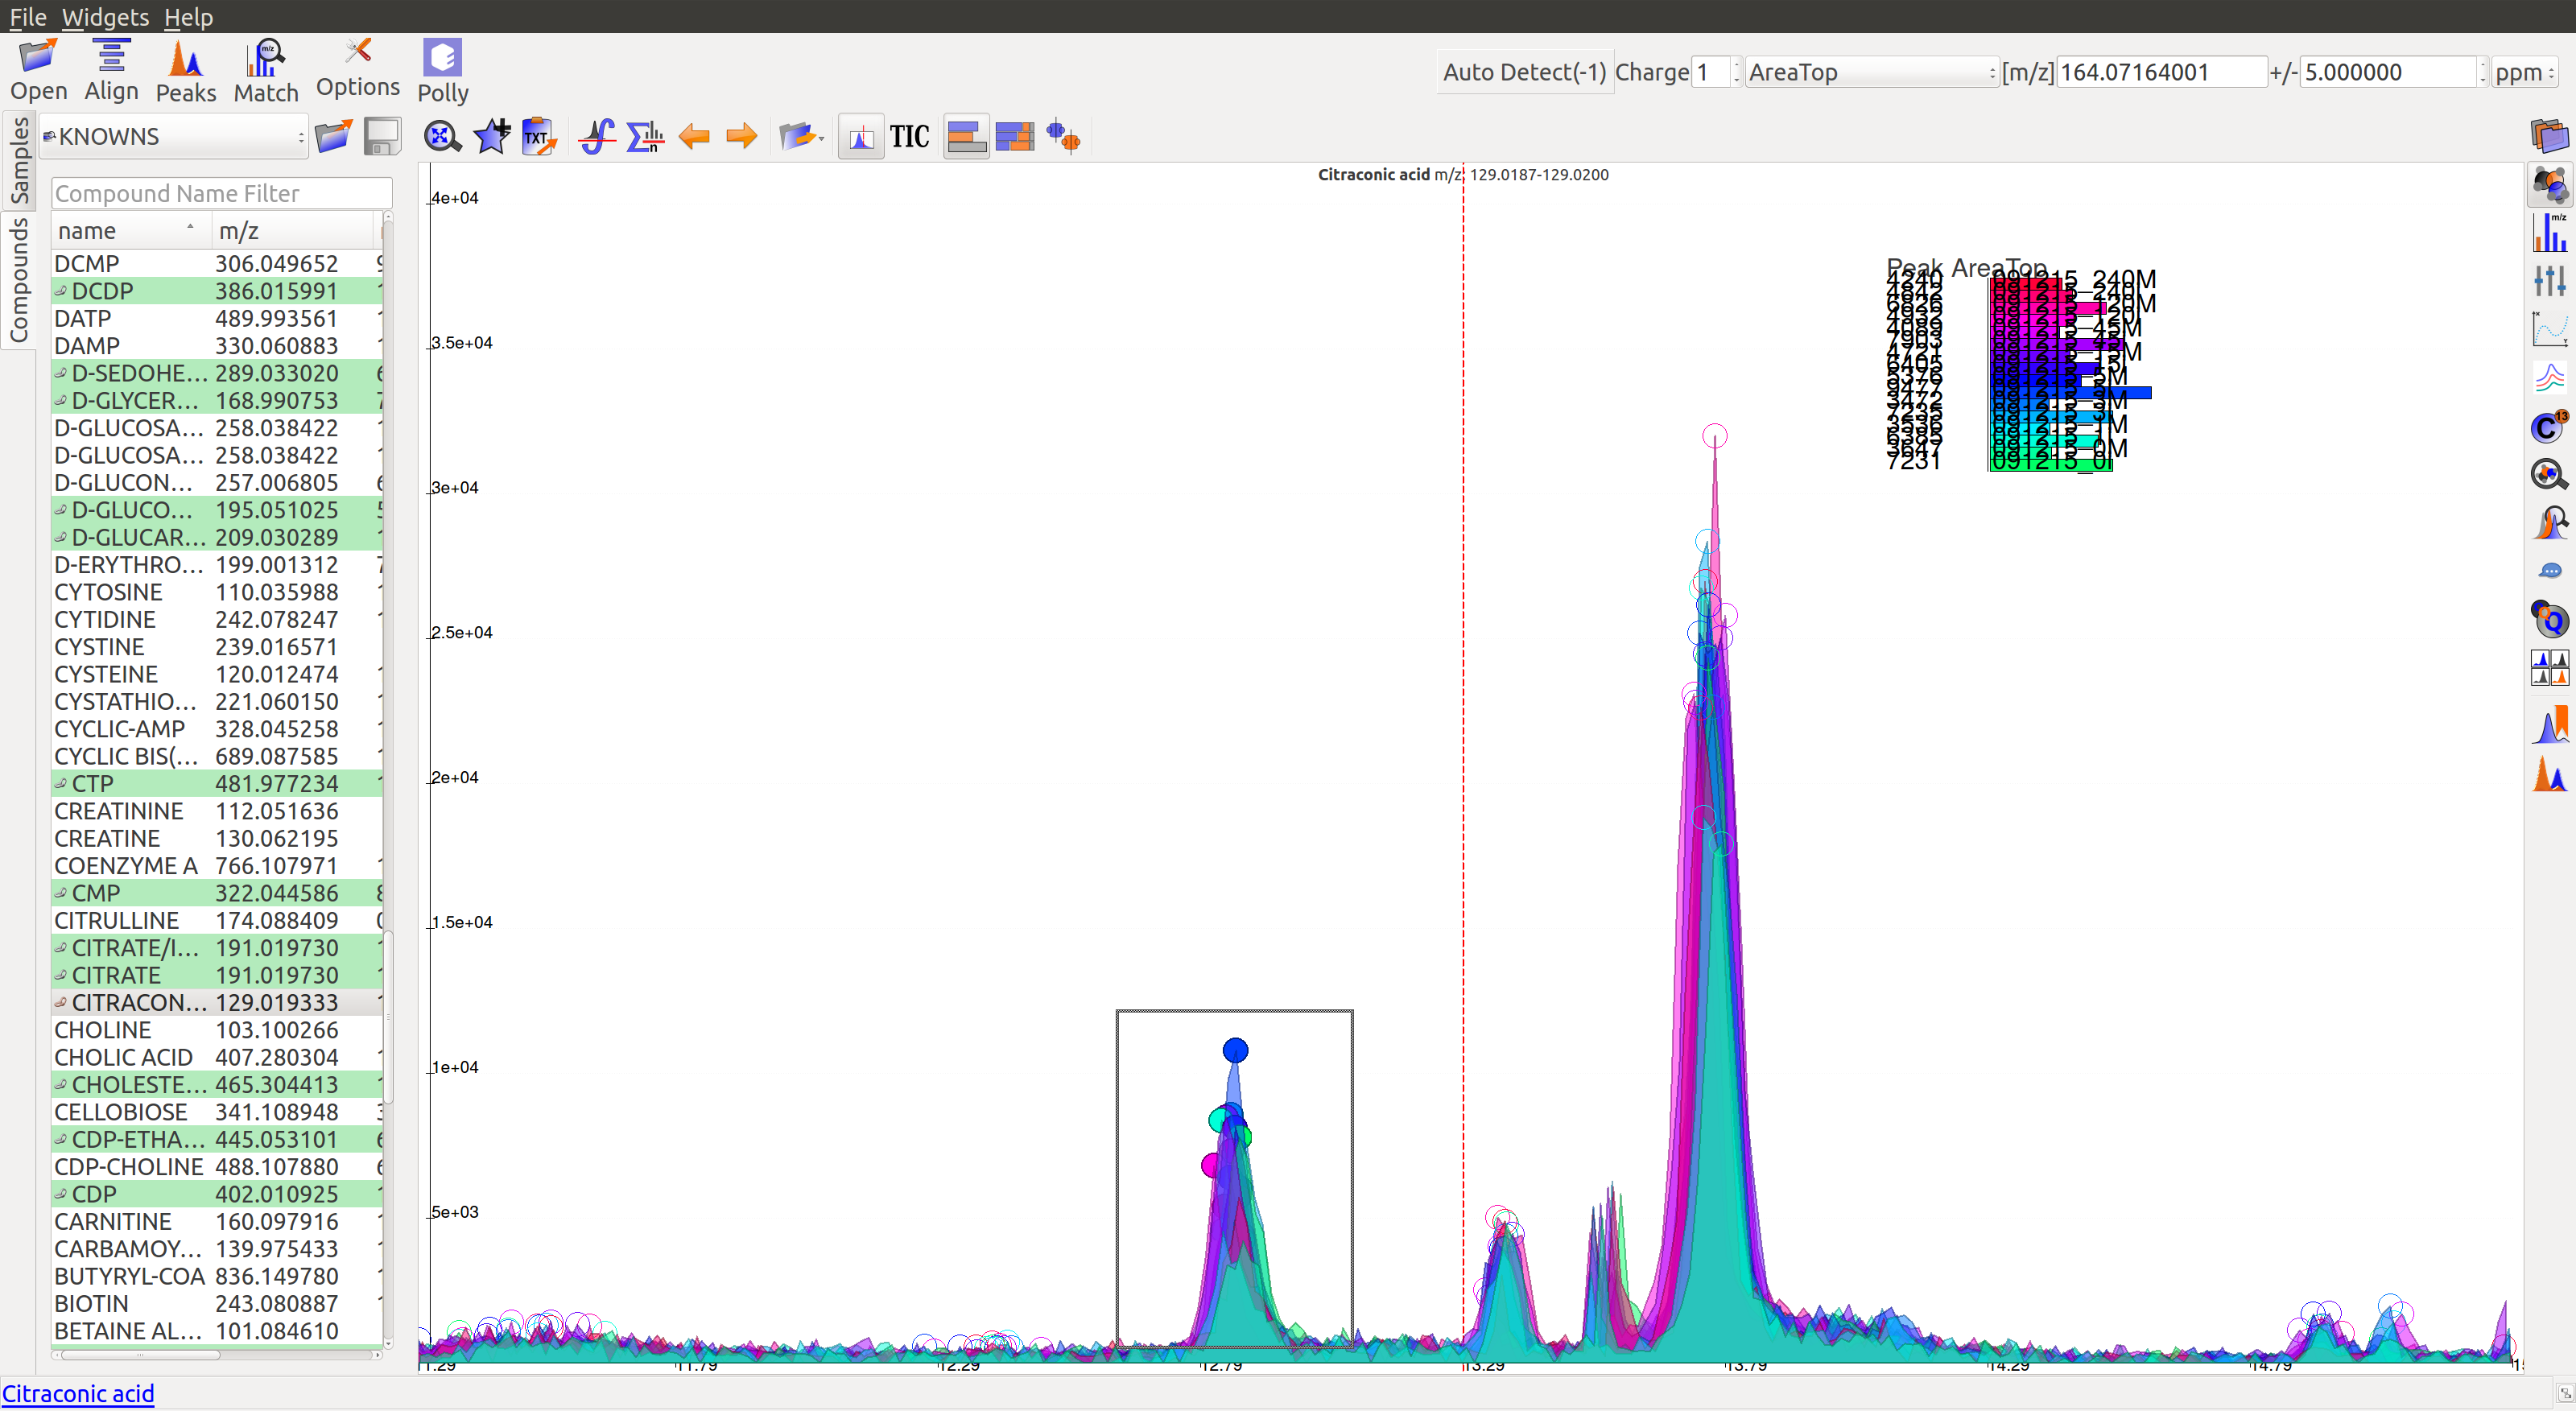
- For low intensity groups like this, the peak characteristics can be determined by zooming in.
The mouse can be used to select the area of the peak as shown below
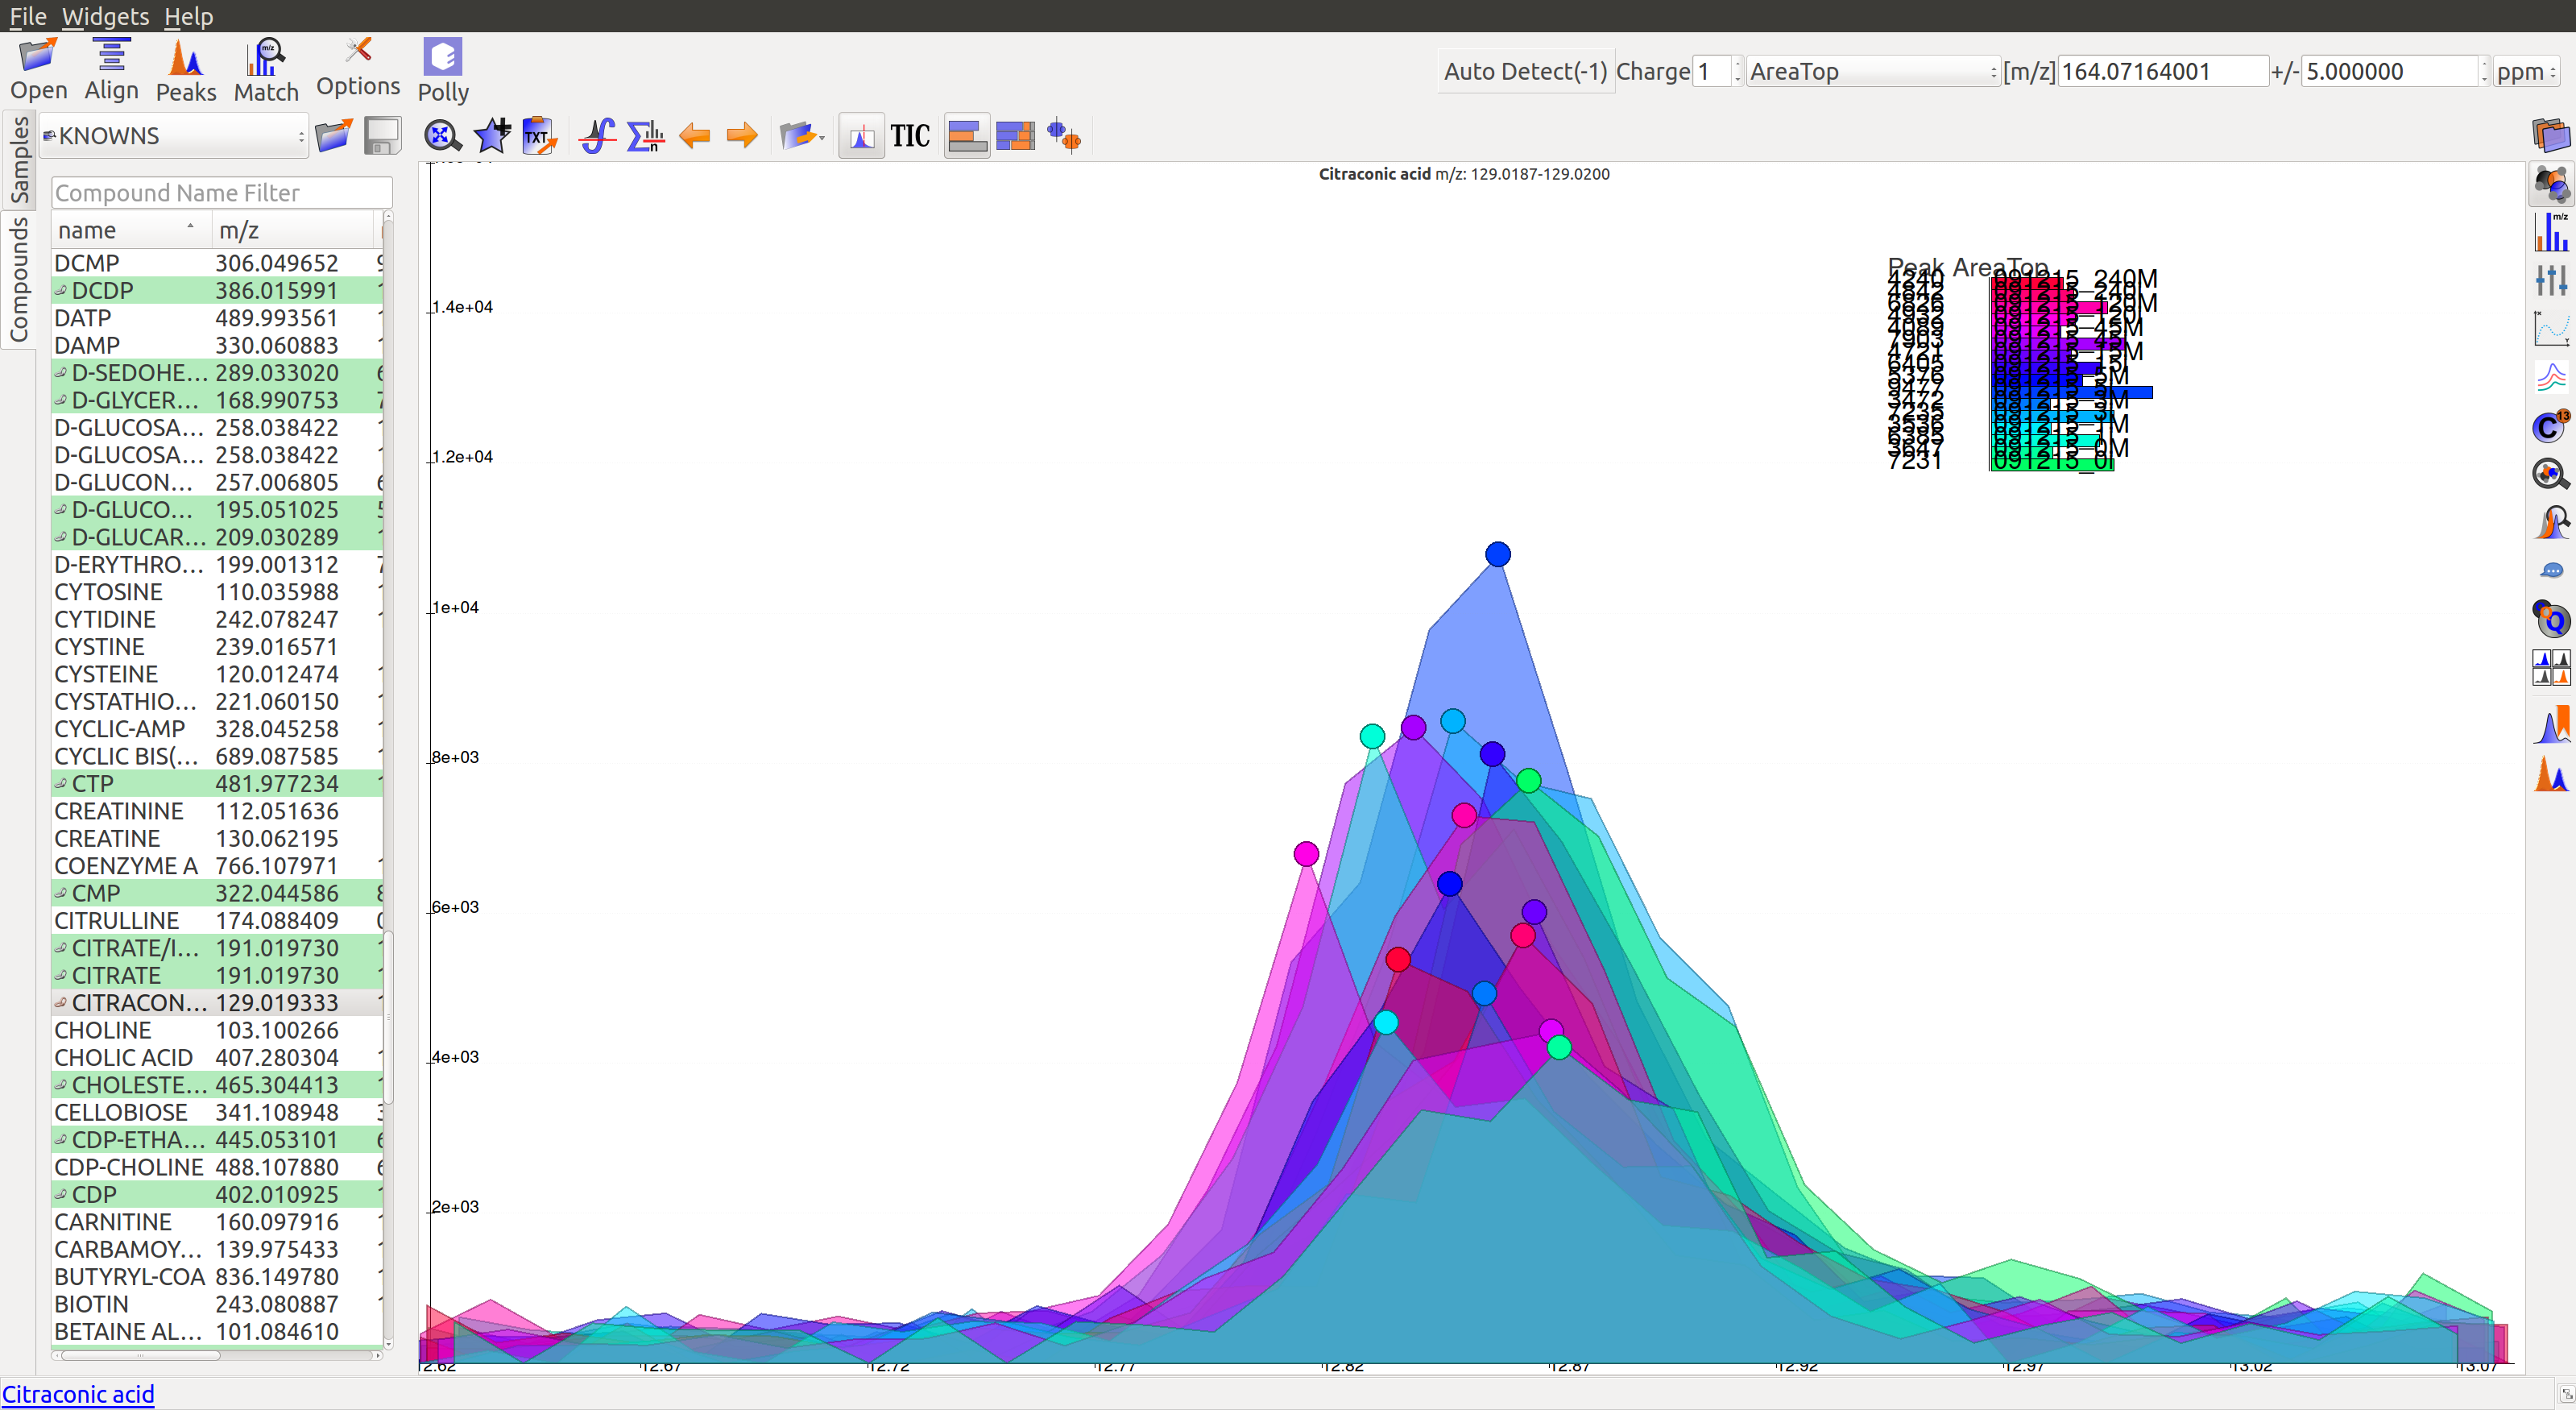
On zooming, it will be easy to make a decision on peak quality
Note
Users can mark any ambiguous peaks as good, and can review all such peaks later in the process.
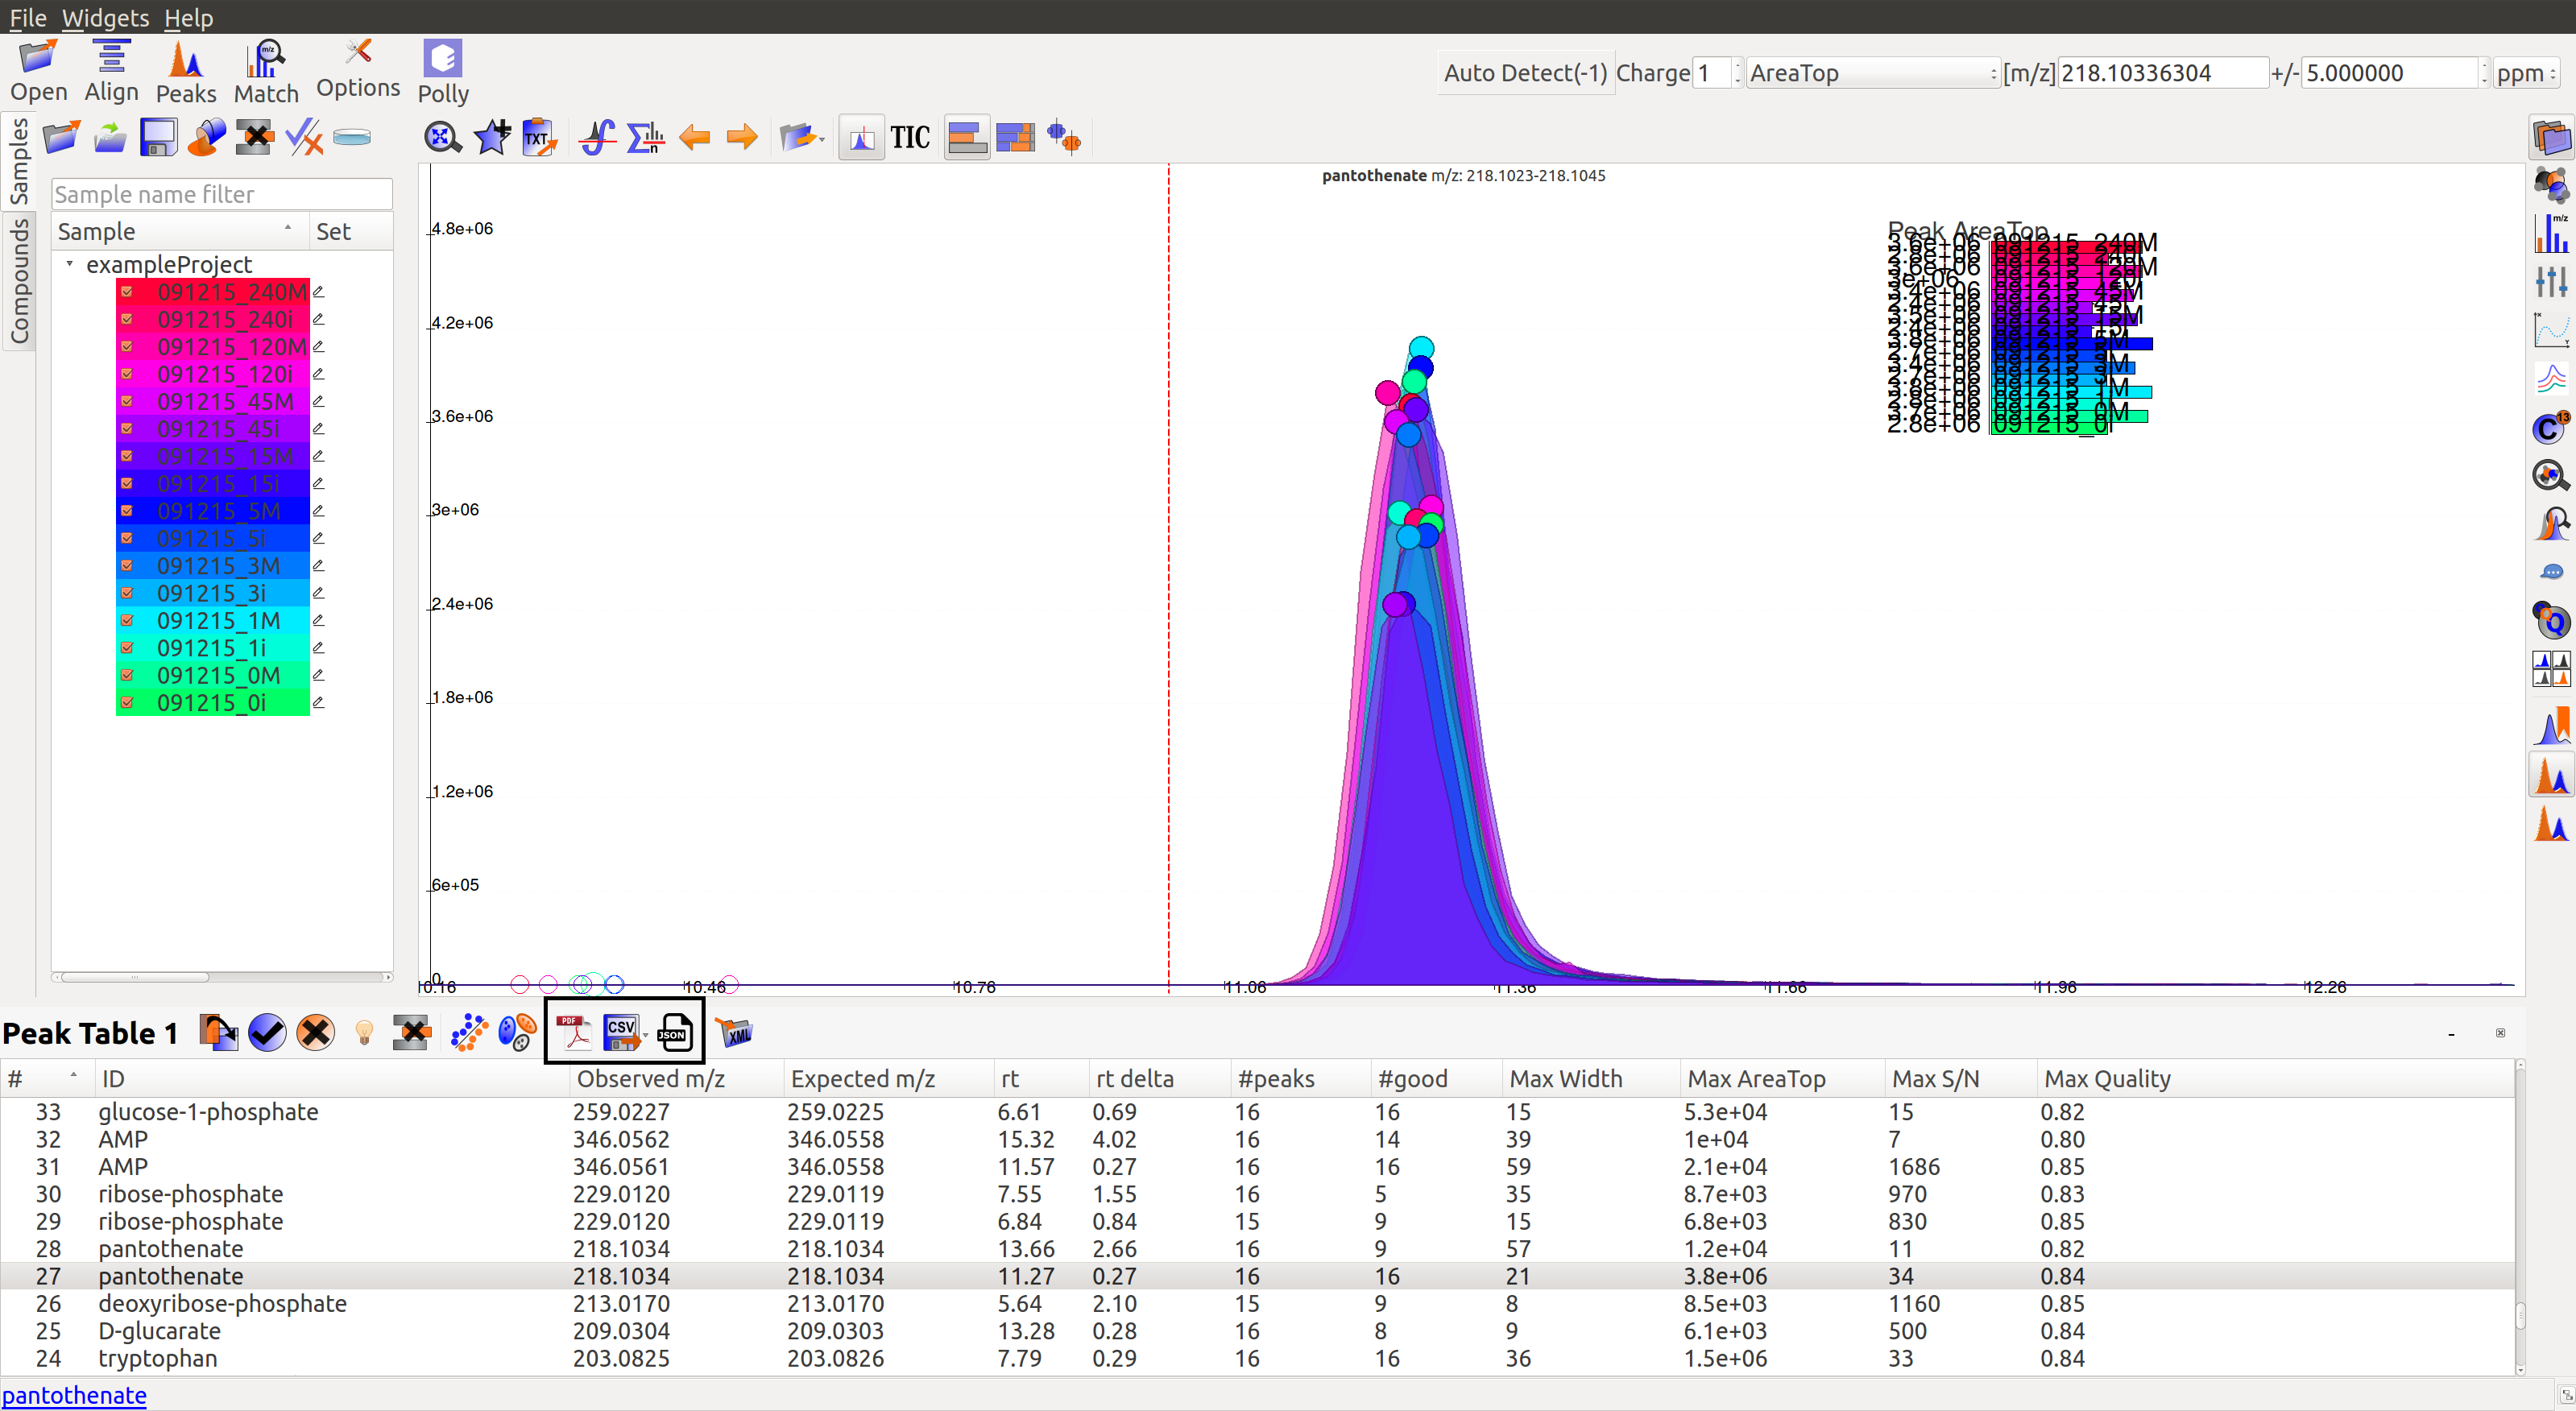
Export
There are multiple export options available for storing marked peak data. Users can either generate a PDF report to save the EIC for every metabolite, export data for a particular group in .csv format, or export the EICs to a Json file as shown below.
Users can select All, Good, Bad or Selected peaks to export.
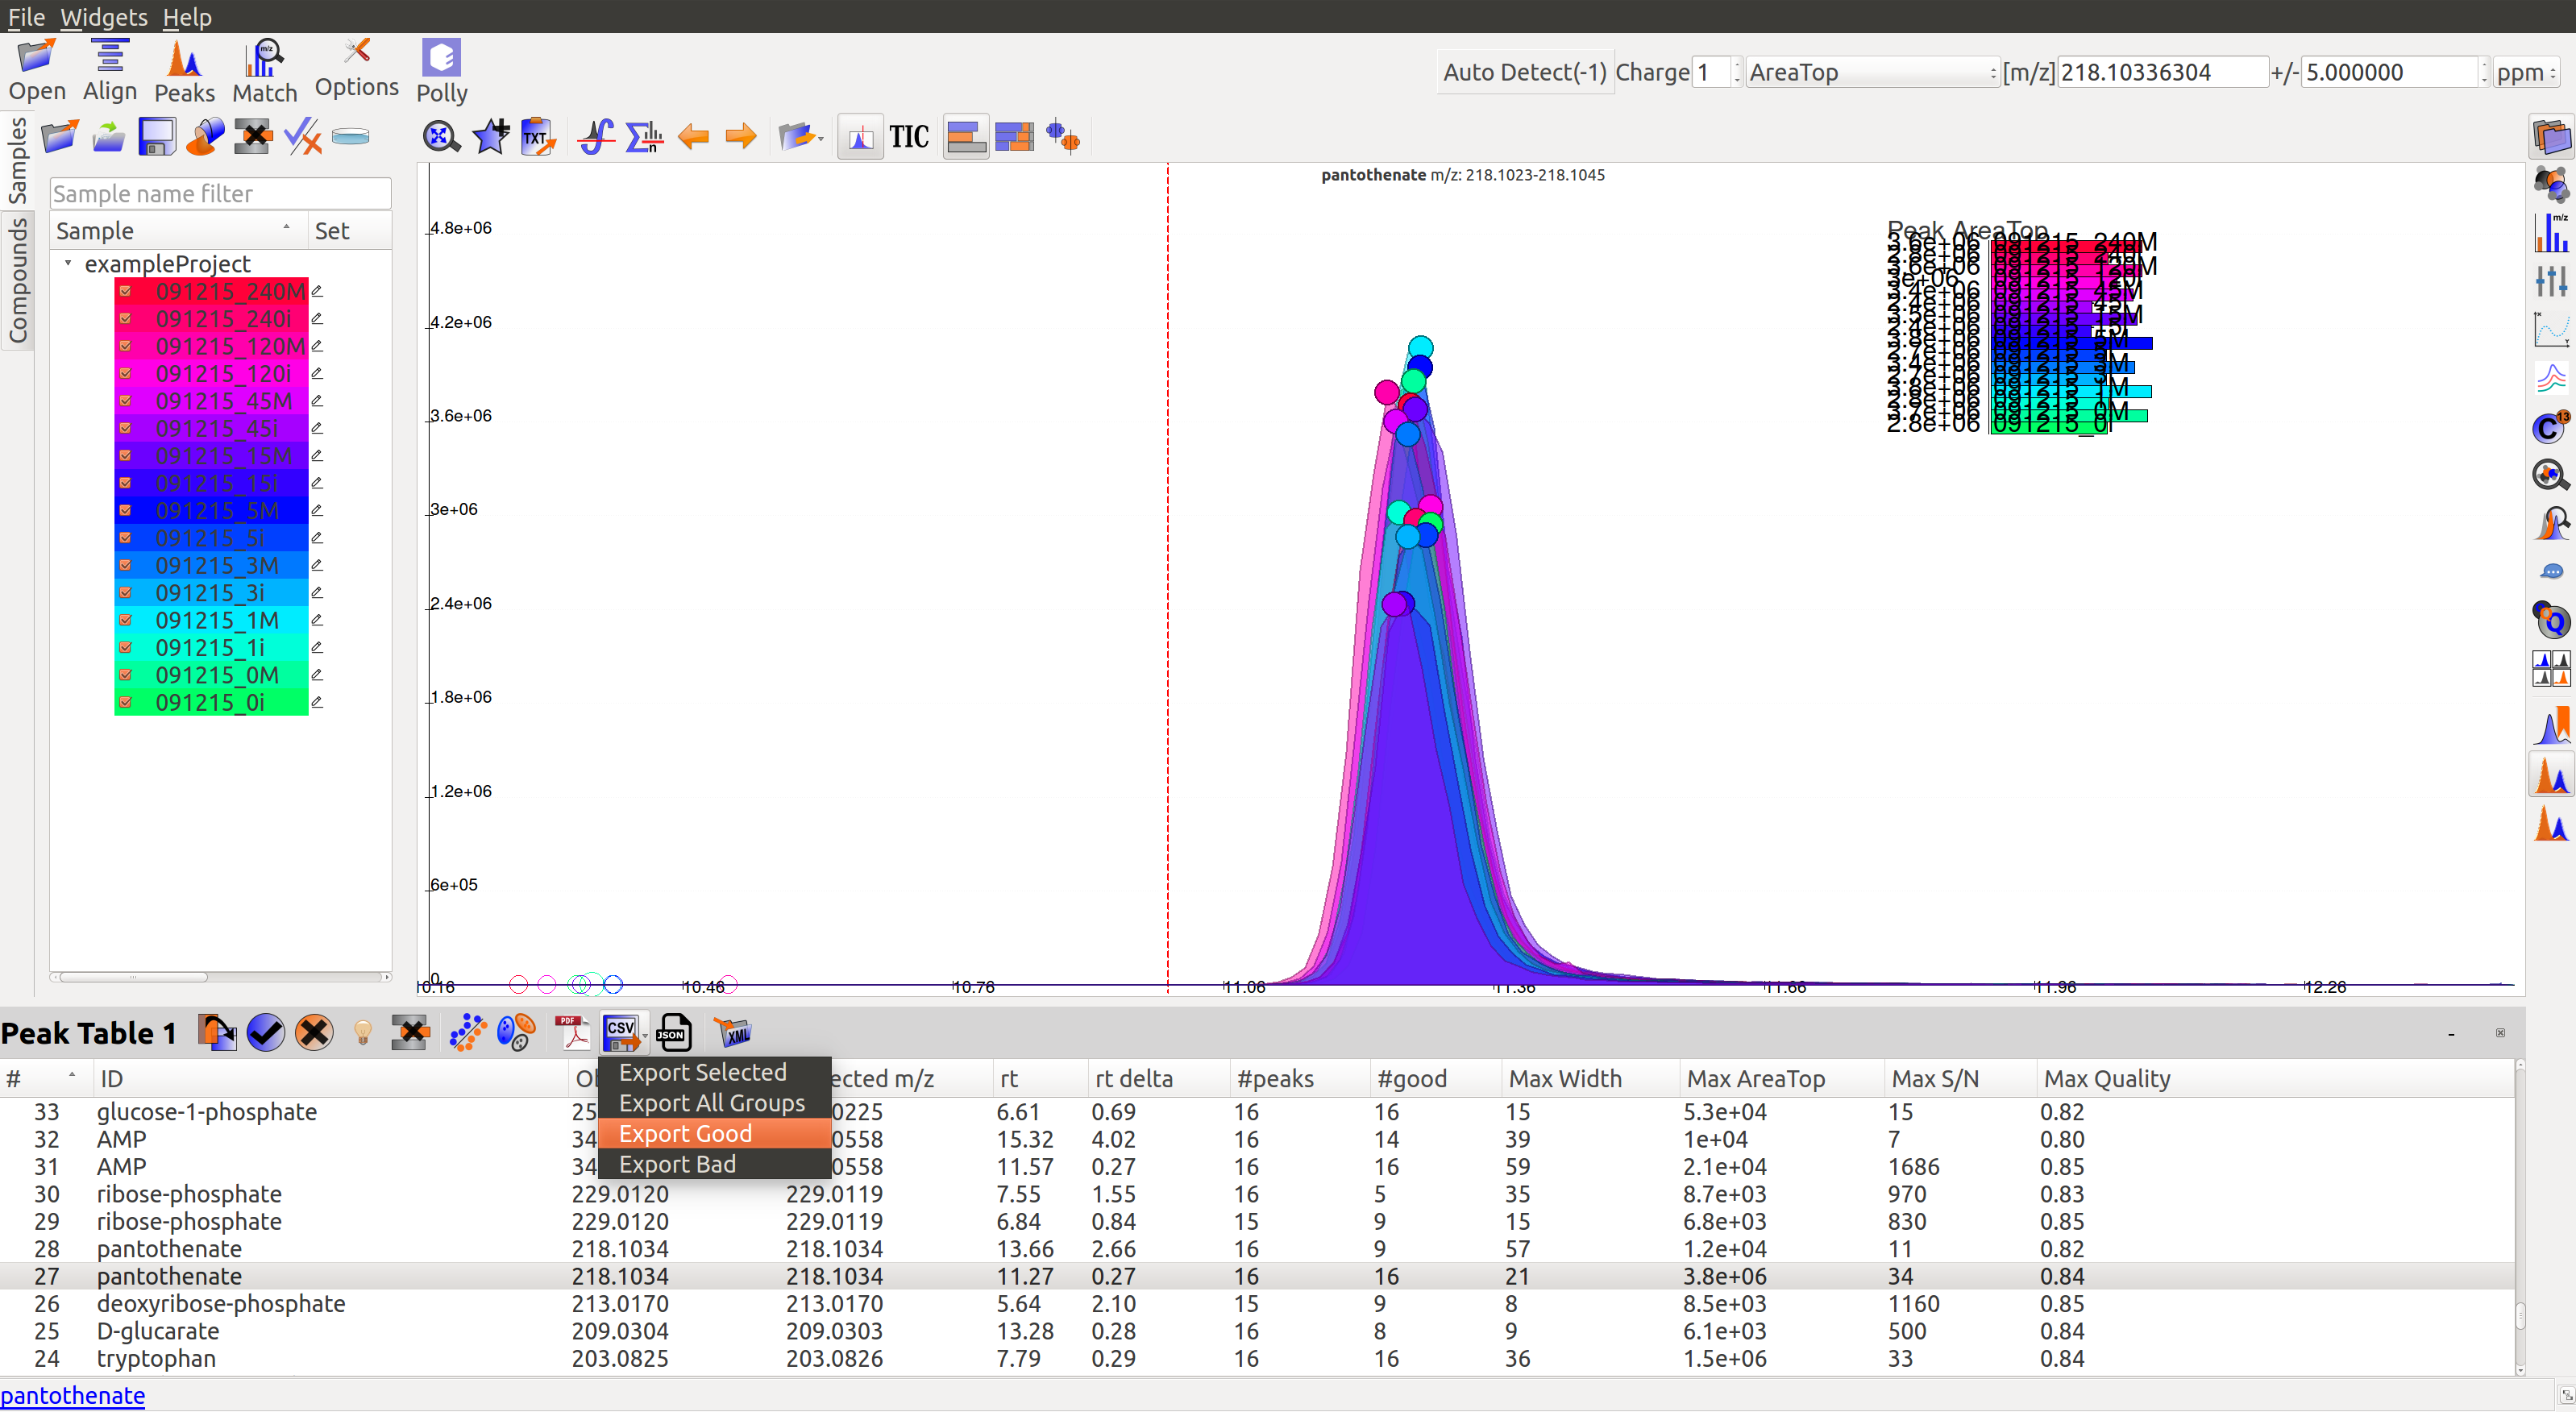
The Export Groups to CSV option  lets the users save the ‘good’/’bad’ labels along with the peak table. Users also have the option to filter out rows that have a certain label while exporting the table.
Generate PDF Report option  saves all EICs with their corresponding bar plots in a PDF file.
Export EICs to Json option  exports all EICs to a Json file.
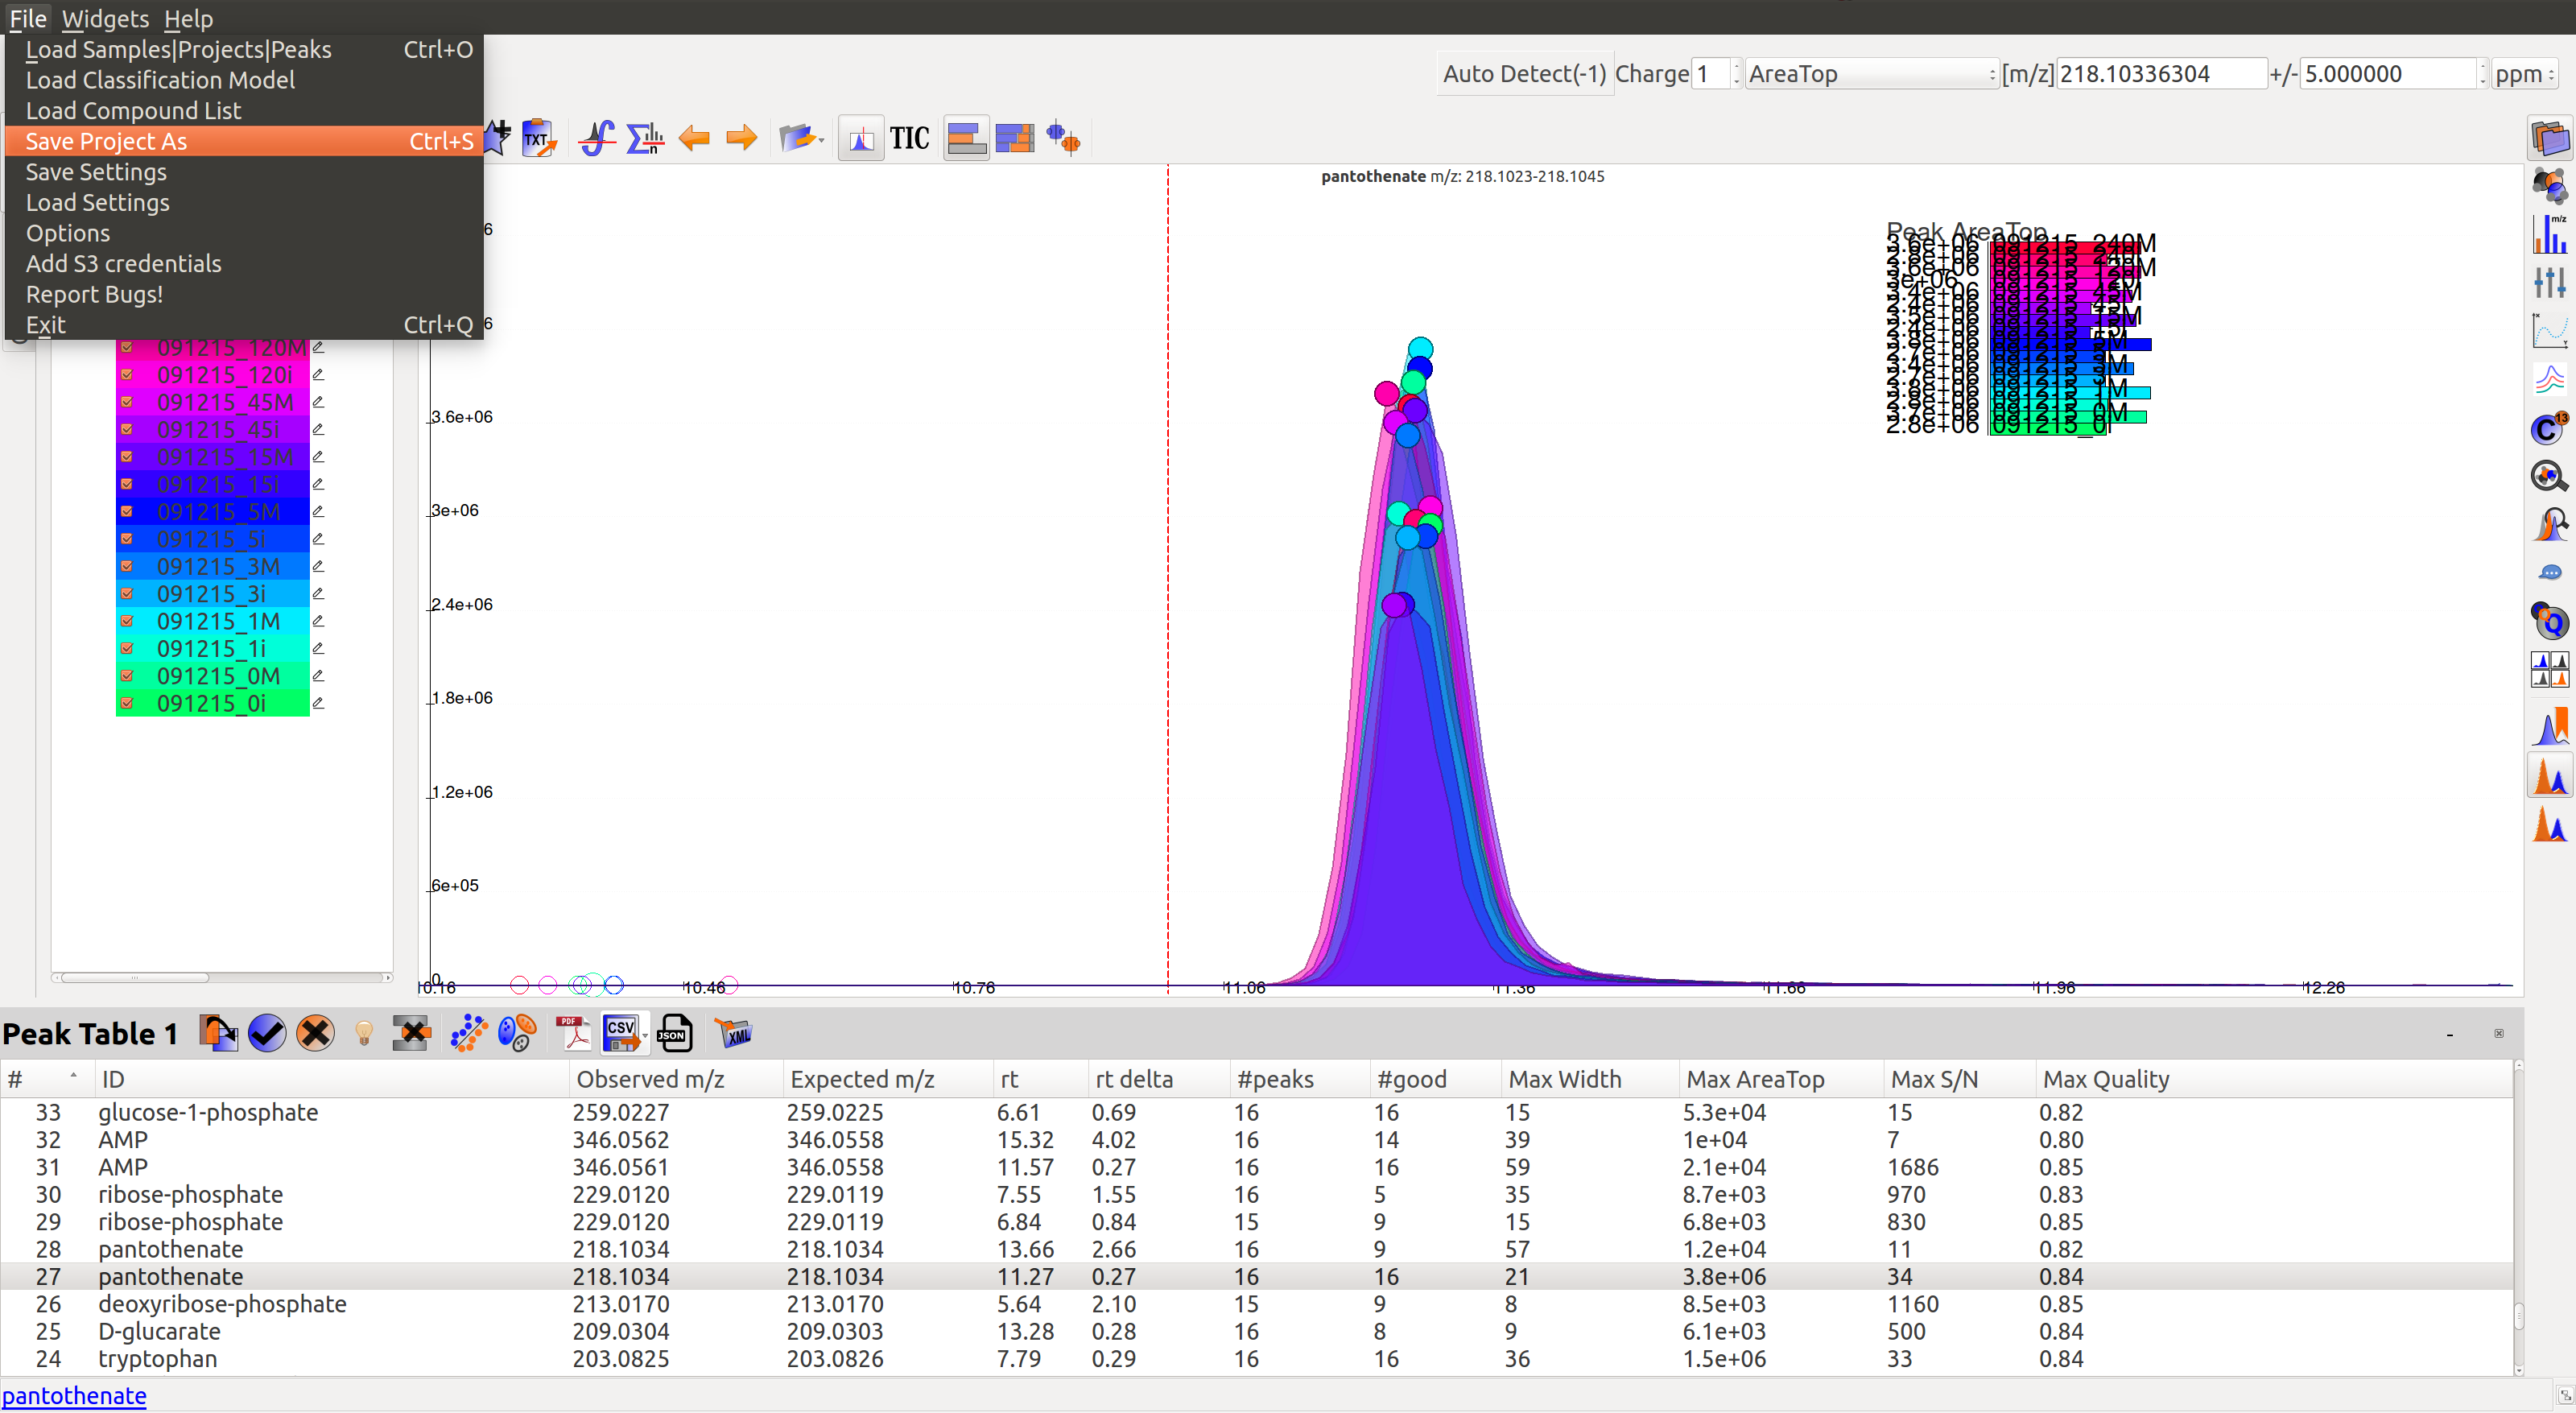
Another option is to export the peak data in .mzroll format that can be directly loaded into El-MAVEN by clicking on the Load Samples|Projects|Peaks option in the File menu. For this, go to the File option in the menu bar, and click on ‘Save Project’.